

Goldman Sachs analyst James Yaro wrote in a client note this week that Bitcoin’s decline has “approximately reached the historical peak to trough average” for this cycle.
Key Takeaways
- Goldman Sachs analyst James Yaro calls BTC decline near cycle average
- LTH profitability collapsed from 58% to 3% in 142 days
- LTH-NUPL remains above zero – full capitulation not confirmed
- Bernstein reaffirms $150,000 year-end price target for 2026
Goldman Sachs: Attractive Entry, With a Caveat
According to Forbes, Yaro observed that Bitcoin and crypto-linked stocks have shown “volatile but flattish performance in the past few weeks”, a stabilisation pattern consistent with a market working through its final distribution phase. Goldman holds a buy rating on Robinhood, Figure Technologies, and Coinbase, all trading at least 50% below their all-time highs. Yaro described the current setup as “an increasingly attractive entry point to our digital-asset sensitive coverage, albeit selectively, across the group,” with valuation becoming more compelling in names less directly exposed to crypto price movements.
Yaro added one specific qualification to the call. Trading volumes may fall further before recovering, noting that “prices may have troughed, but volumes could fall somewhat further, although the impact appears manageable.” A sustained volume decline could reduce 2026 revenue by 2% and profits by 4% for crypto companies. Trough crypto volumes typically persist for a median of three months before meaningfully rebounding.
Separately, Goldman CEO David Solomon disclosed he now personally holds a small amount of Bitcoin, a direct reversal from his 2024 position that he saw no “real use case” for the asset.
The bottom in price and the bottom in activity are not the same event. That distinction is precisely what the on-chain data makes visible.
What the On-Chain Data Actually Shows
The adjusted Net Unrealized Profit/Loss metric for long-term holders, tracked by Axel Adler, on-chain analyst at CryptoQuant, measures the aggregate unrealised gain or loss position of Bitcoin addresses holding for extended periods. Since Bitcoin’s October 6, 2025 peak, LTH profitability has collapsed from 58% to just 3% in 142 days. That compression is sharp, one of the most aggressive deteriorations visible across the chart’s history — and it reflects a fundamental shift in how positioned the most conviction-driven cohort in the market actually is.
LTH-NUPL remains marginally above zero. It has not crossed into negative territory. Adler’s historical analysis is specific: durable market bottoms have only been established once long-term holders were pushed into net losses, a stress phase that lasted 6 days in the 2020 flash crash, 165 days through 2019, and 277 days across the 2022 bear market. The current environment is consistent with the final stage of that stress. It has not completed it.
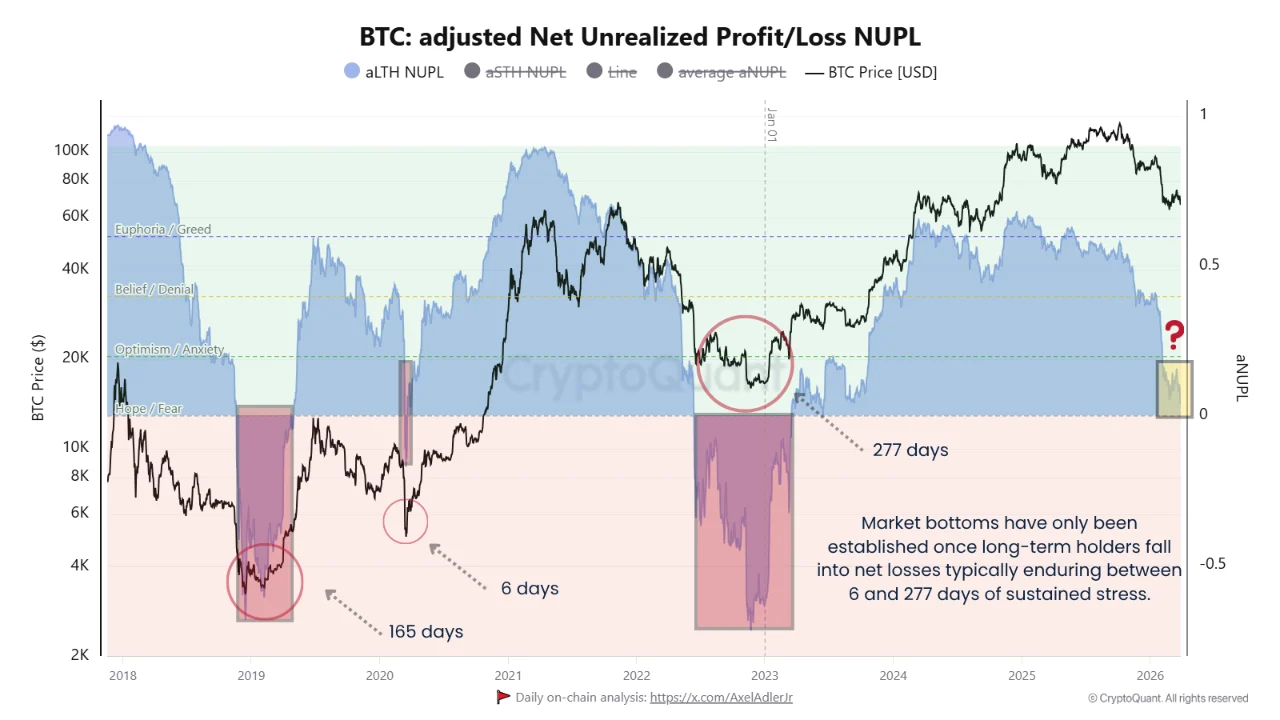
Market bottoms are not formed when investors are under pressure. They form when investors are structurally underwater, when accumulated gains have fully evaporated and positions have turned into realised losses. That forced realisation clears the market of sellers who were waiting for a recovery that never arrived and creates the asymmetric entry conditions that follow. Adler’s conclusion is direct: the opportunity is forming. The signal has not been triggered.
What would trigger it is a sustained move of LTH-NUPL below zero accompanied by prolonged price compression. That would indicate forced stress and potential capitulation rather than the late-stage stress phase the data currently describes.
What the Price Chart Shows
On the one-hour Binance chart, Bitcoin reached near $71,750 on March 25, sold off sharply through March 26 and 27 to a low near $65,500, then partially recovered and has been consolidating in the $66,000–$67,000 range through March 28 and 29.
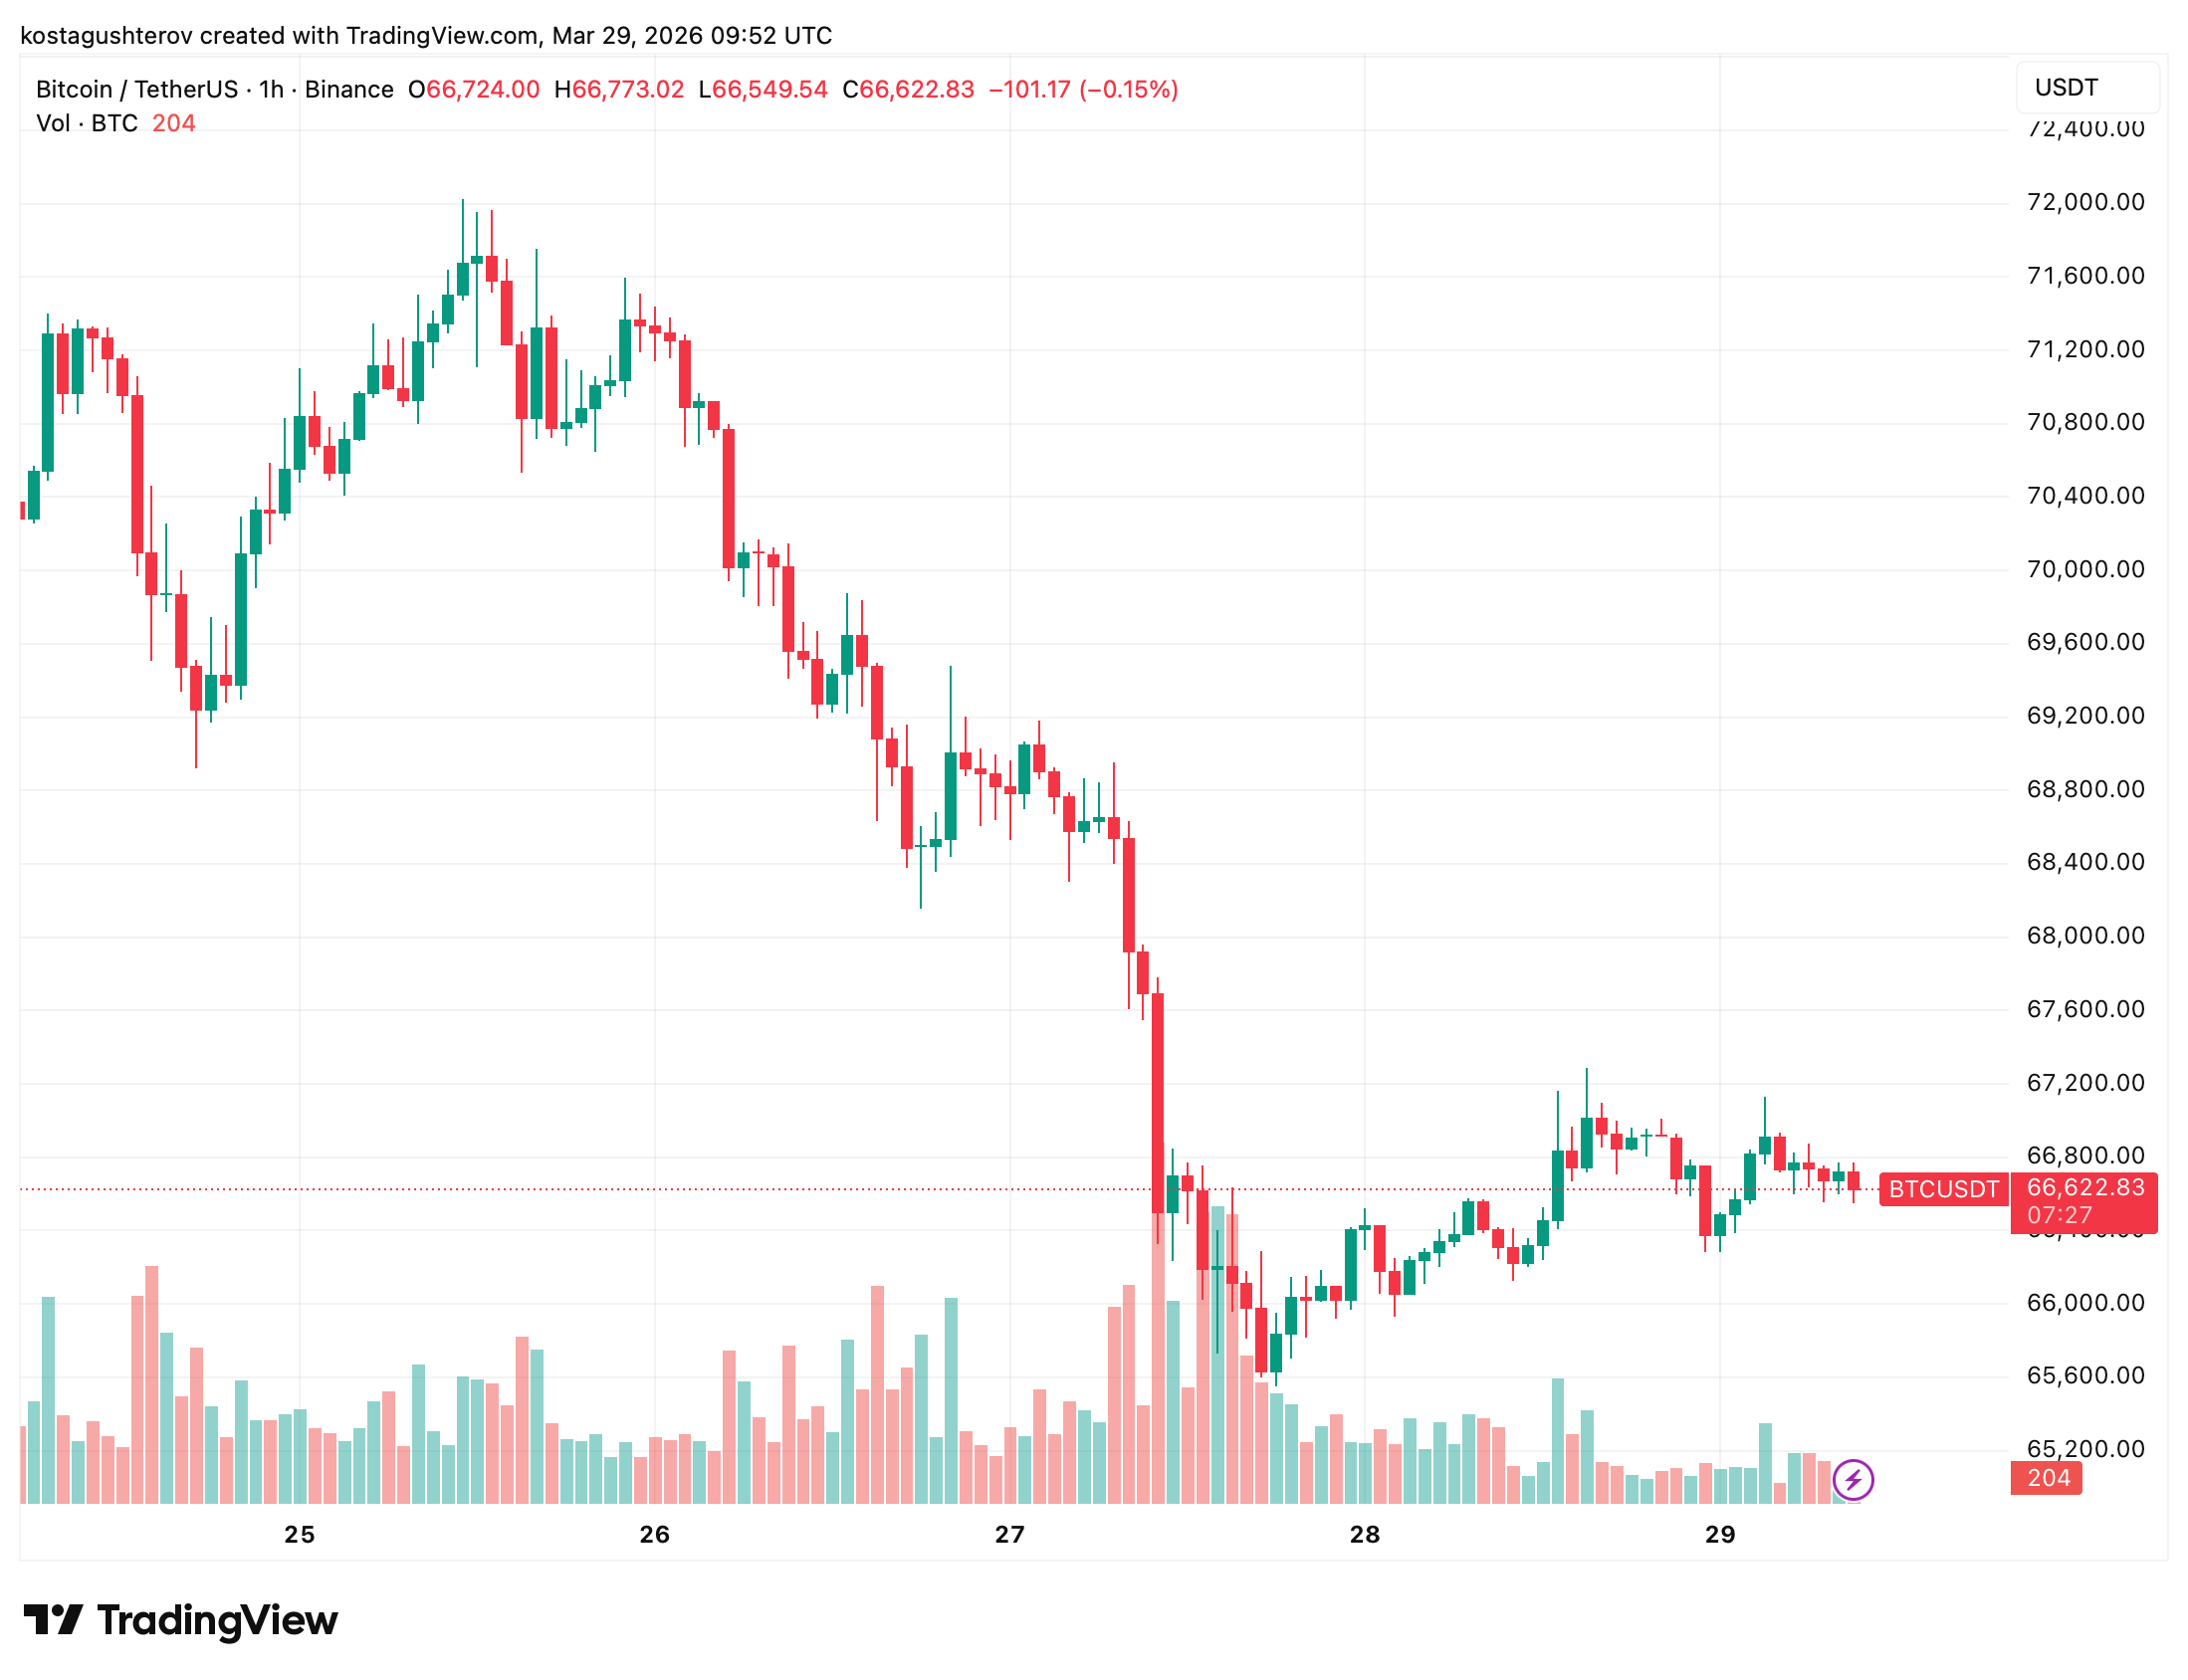
The stabilisation Goldman is reading as a bottom forming is visible in the price action. Volume on the consolidation candles is significantly lower than volume on the selling candles that preceded them, the market has stopped falling but has not yet found the demand to recover meaningfully above where it stopped.
Price consolidation below the prior breakdown level, with declining volume on the recovery, is consistent with a market in late-stage stress rather than one establishing a new base. The NUPL reading and the price structure are describing the same condition from different angles.
Bernstein: The Weakest Bear Case in Bitcoin’s History
Bernstein analysts recently reaffirmed their $150,000 year-end price target for 2026, arguing that Bitcoin has likely found its bottom and is heading higher. The structural argument is specific. Unlike prior downturns, this cycle has produced no leverage collapses, no exchange failures, and no systemic breakdown in market infrastructure. Bernstein describes this as the weakest bear case in Bitcoin’s history, a correction driven by sentiment rather than structure, which historically resolves faster and with less lasting damage to the demand base.
The institutional demand layer that previous cycles lacked is cited as the key stabilising difference. Spot Bitcoin ETF inflows and expanding corporate treasury demand have created persistent buying that absorbs selling pressure in ways the 2018 and 2022 markets could not. Strategy’s recent $76.6 million Bitcoin purchase is named specifically as evidence of structural demand remaining active through the drawdown. As financial conditions improve and Federal Reserve rate cuts become more likely, Bernstein expects ETF inflows to accelerate — the mechanism that would convert price stabilisation into sustained recovery.
What the Data Leaves Open
Goldman is calling the bottom from a price and cycle average perspective. Bernstein is calling it from a structural one. Adler’s NUPL framework is calling it a late-stage stress phase, the condition immediately preceding confirmed bottoms in prior cycles, not the confirmation itself.
The bottom in price and the bottom in on-chain stress do not arrive on the same day. Adler’s framework identifies the condition that has historically confirmed the bottom rather than the one that precedes it. LTH-NUPL crossing below zero and sustaining there long enough to force loss realisation at scale is the signal. It has not fired.
LTH profitability was at 58% in October. It is at 3% now. The distance to zero has never been smaller in this cycle.

Kosta joined the team in 2021 and quickly established himself with his thirst for knowledge, incredible dedication, and analytical thinking. He not only covers a wide range of current topics, but also writes excellent reviews, PR articles, and educational materials. His articles are also quoted by other news agencies.