

Ethereum dropped to $2,038 after Trump ruled out de-escalation with Iran, triggering $968 million in forced selling on Binance alone.
Key Takeaways
- ETH dropped to $2,038 at 10:59 UTC April 2, breaking below 50 SMA at $2,098 on heavy volume.
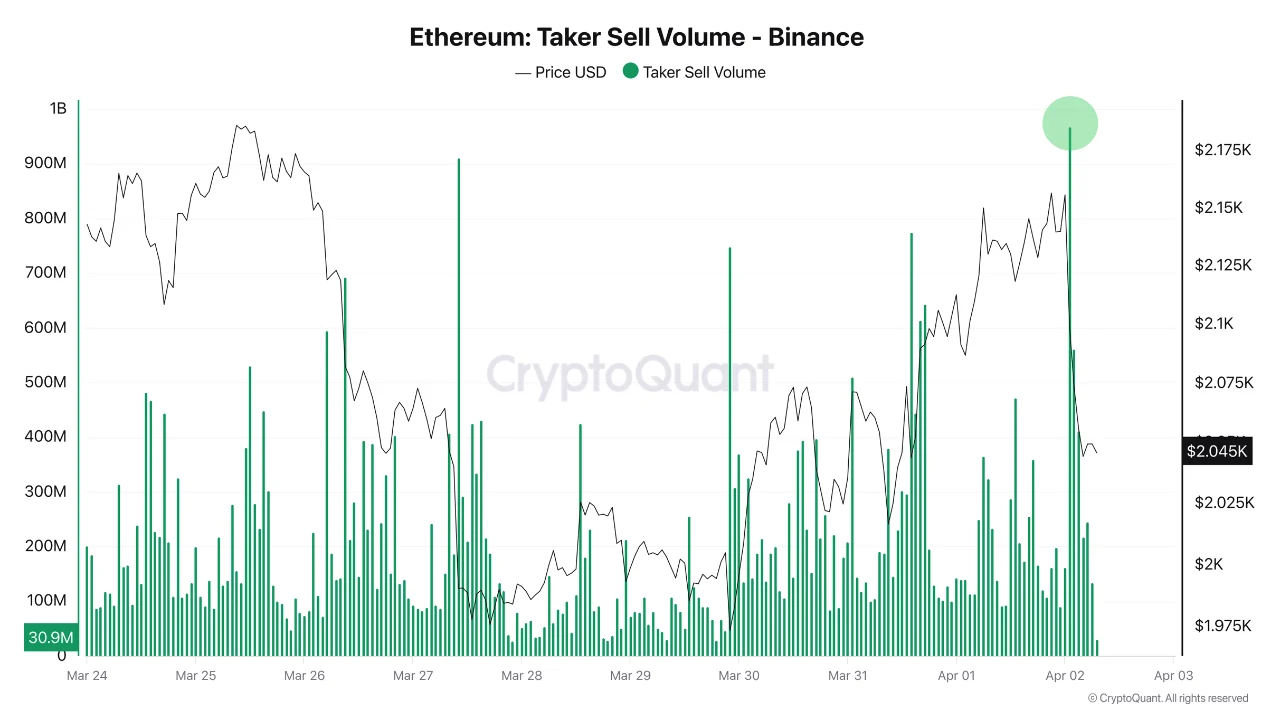
- $1 billion in ETH sell volume hit derivatives in one hour post-Trump speech, $968M on Binance alone.
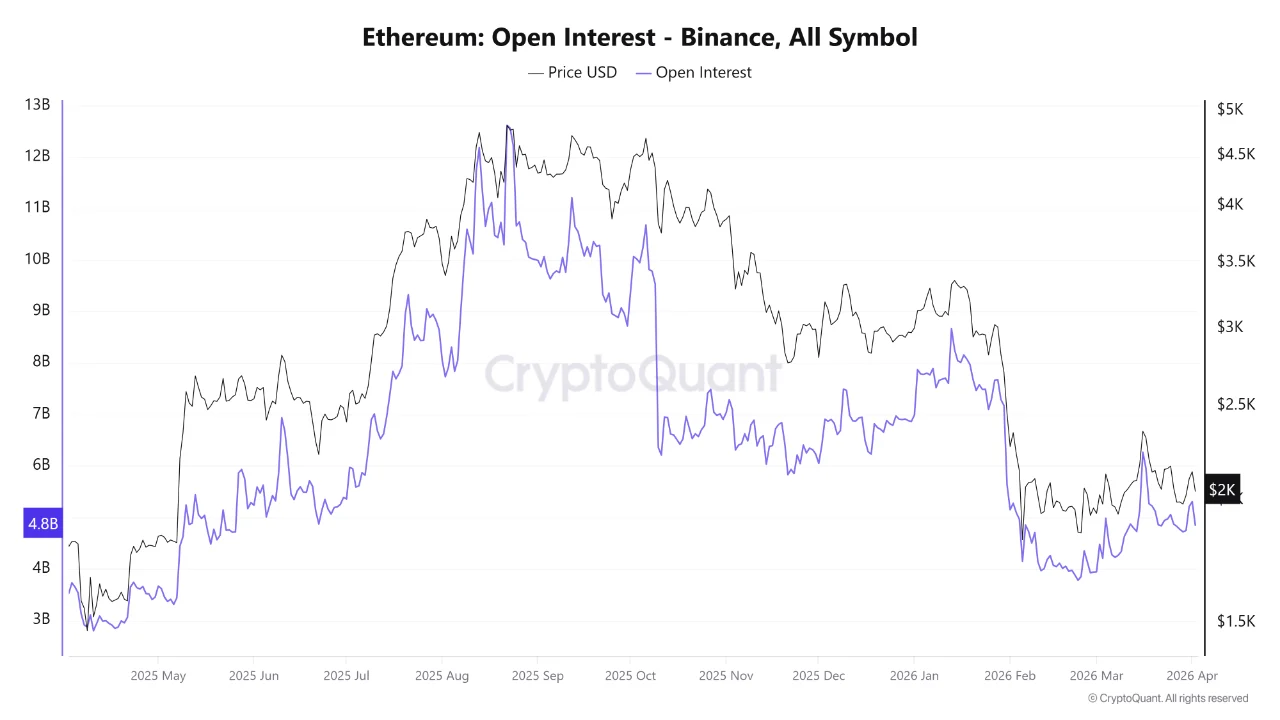
- Open Interest collapsed alongside price – forced liquidations, not organic selling.
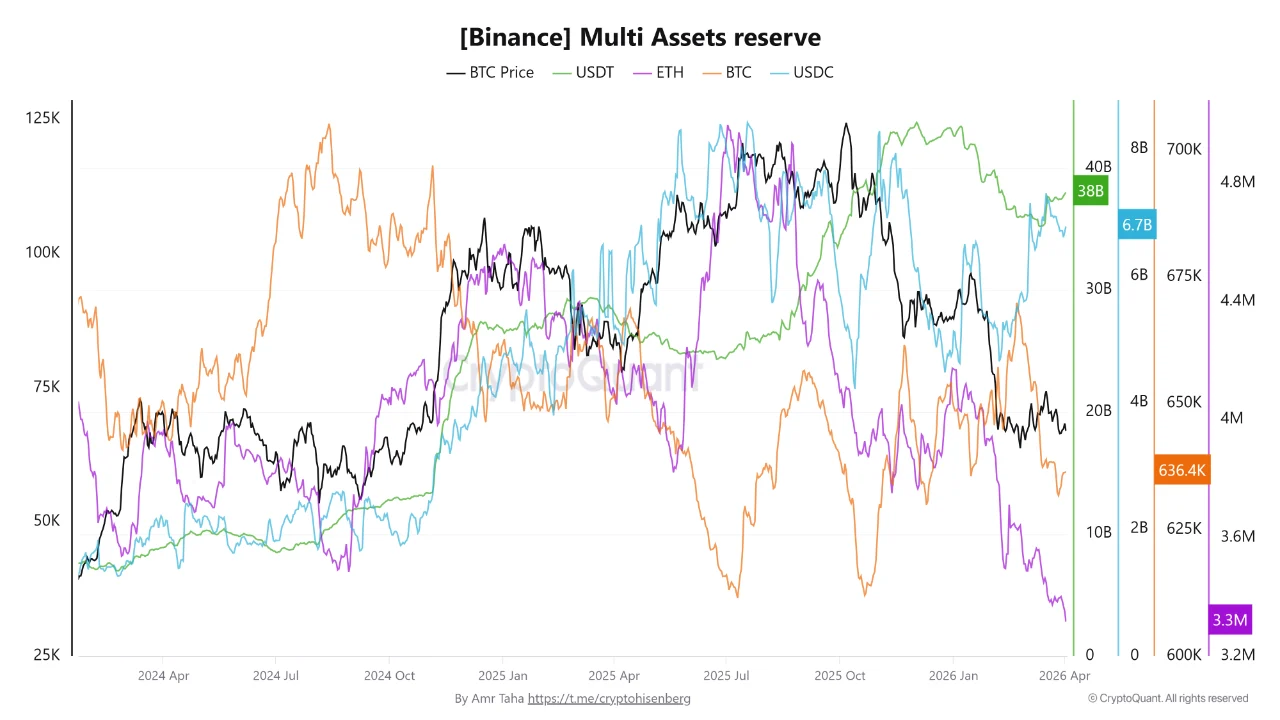
- Binance ETH reserves fell to 3.3M ETH – lowest since February 2024.
- Glamsterdam upgrade targeting June 2026 .
The $2,160 high that ETH printed on April 1 lasted less than 24 hours. It was not a weak high, volume was supportive, the RSI had recovered from the low-2,000s, and for the first time in weeks the hourly structure showed something resembling a trend. Traders who had been sitting on the sidelines through five weeks of war-driven selling had a setup. It disappeared overnight, not because the market changed its mind, but because the president changed the conversation.
Trump’s speech ruled out any near-term de-escalation with Iran, promised to hit ‘extremely hard‘, and offered no plan to reopen the Strait of Hormuz.
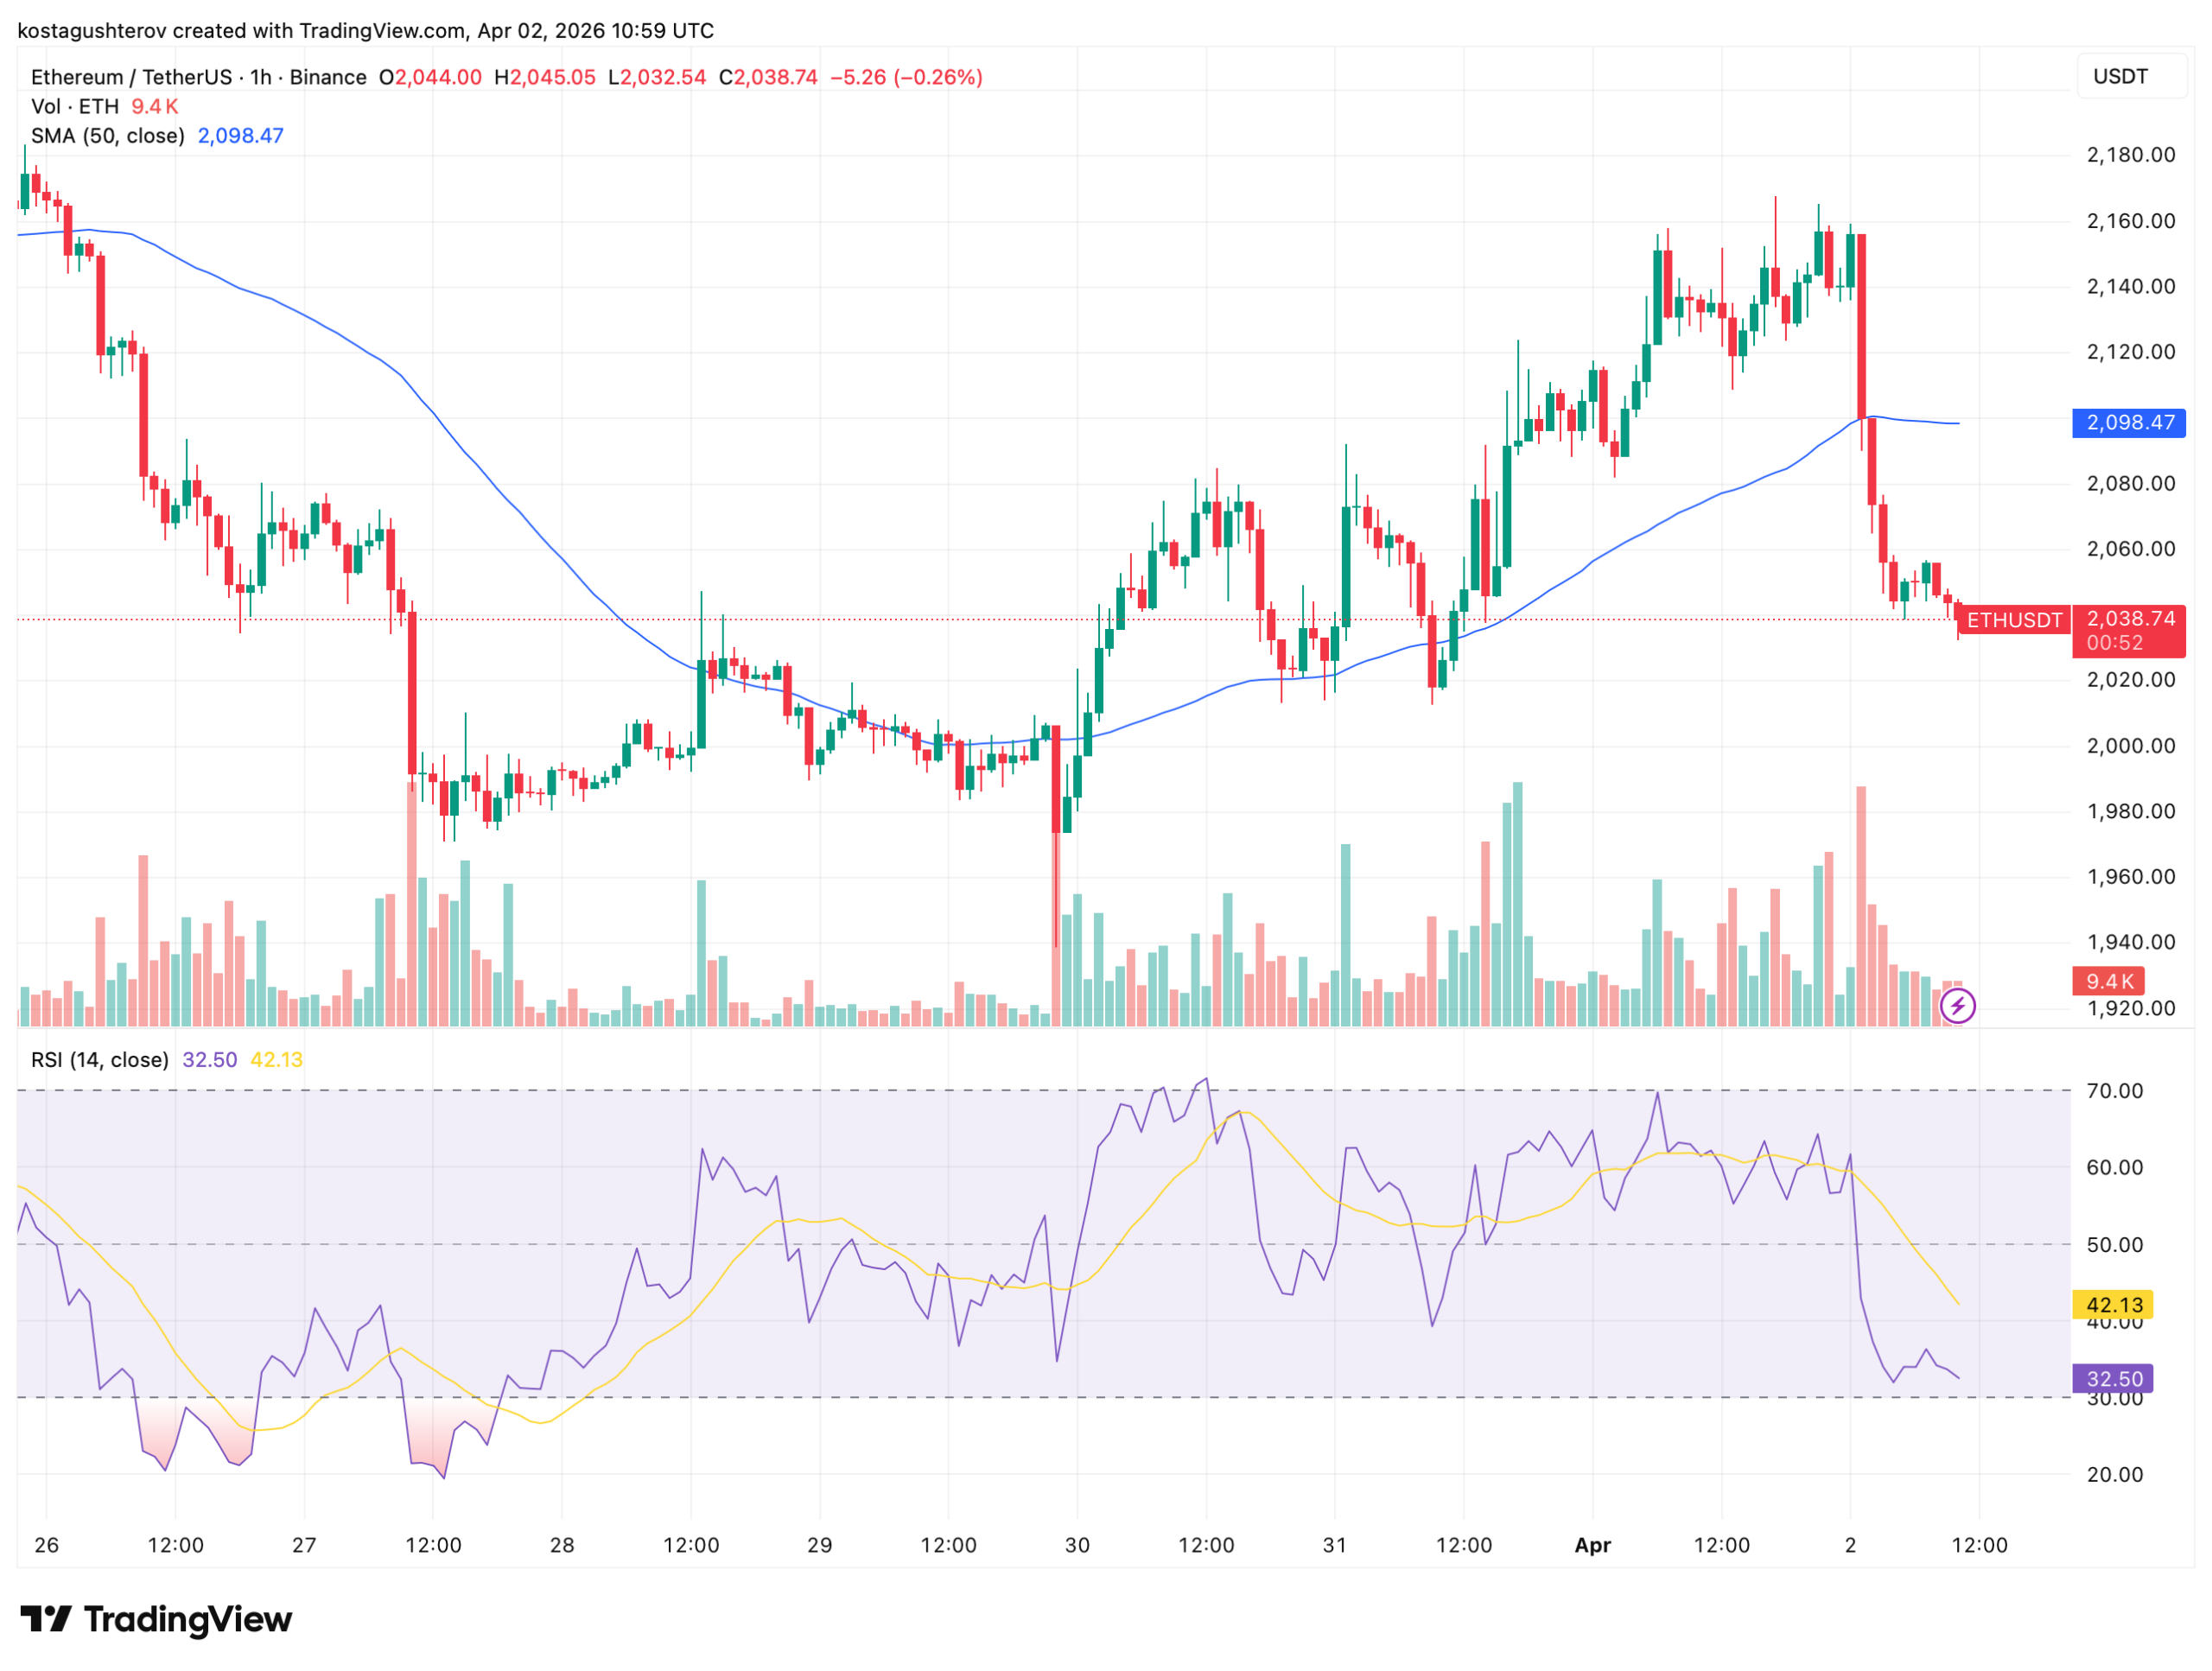
By 10:59 UTC on April 2, ETH was trading at $2,038, $60 below the 50 SMA at $2,098, with the RSI printed at 32.50 and still falling. The hourly chart shows one defining candle on the right edge: large, red, and uncontested.
One Hour, One Billion Dollars
The speed of the move is what separates this from ordinary selling.
In the single hour following Trump’s address, more than $1 billion in ETH sell volume flooded the derivatives market, according to CryptoQuant data. Of that, $968 million landed on Binance alone, the exchange currently recording the highest derivatives volume in the industry. Simultaneously, the S&P 500 wiped $500 billion in market capitalization within minutes of the same speech.
Over 140,000 crypto market participants were liquidated in the following 24 hours, with total liquidations reaching $422 million, of which long positions accounted for $249 million, according to CoinMarketCap data.
This was not a market making a decision. This was a market getting a decision made for it.
What the Derivatives Market Shows
When price and Open Interest fall together, the interpretation is specific: leveraged positions are being forcibly removed, not deliberately closed. That is what happened here.
CryptoQuant’s Open Interest data for Binance confirms the pattern, a sharp simultaneous collapse in both price and OI during the post-speech selloff, consistent with forced liquidations rather than strategic repositioning. The longs that had been built during the $1,980 to $2,160 recovery were erased in the same hour the speech landed.
Since the flush, OI has edged slightly higher, but the recovery is weak relative to the scale of the drop. Price is attempting to stabilize. New position openings are not following with any conviction. Futures traders are sitting on their hands. Ethereum has been grinding inside a tight range for long enough that positions in either direction tend to get stopped out before they can build momentum, and until a clear directional move forms, OI will stay suppressed and price action will stay fragile.
What matters about the current OI level , sitting near 4.8 billion, compared to the cycle peak of approximately 13 billion in late 2025, is not that it is low. It is that at these levels, in previous cycles, the market has had room to rebuild without the weight of overleveraged positions capping the move. Low OI is not a buy signal. It is a cleaner starting point.
What the Exchange Reserves Show
Beneath the price action, the structure of the market is shifting in a direction the chart alone does not capture.
Binance’s Ethereum reserve has dropped to 3.3 million ETH, falling below the previous lows of 3.53 million ETH recorded in February 2024 and 3.49 million ETH in August 2024, according to CryptoQuant reserve data. Bitcoin reserves on the same exchange have moved in the same direction, declining from approximately 670,000 BTC in early February to 636,000 BTC in early April.
Coins leaving an exchange mean less immediate sell-side supply. When holders move assets to self-custody rather than keeping them available for sale, the structural pressure on price eases, even when sentiment and headlines remain negative.
At the same time, stablecoin balances have been rising. USDT reserves on Binance climbed from $35 billion on March 12 to $38 billion by April 2. USDC reserves grew from $4.6 billion in February to $6.6 billion over the same period. More dollar-denominated capital is sitting on the exchange now than at any point in the past six weeks, available to deploy into spot markets if and when the trigger arrives.
Less ETH available to sell. More capital available to buy. That combination does not produce a recovery on its own. But it means the conditions for one are more developed than the price suggests.
Two Outcomes From Here
If the pressure continues, the technical path lower is clear. The $2,000 level is the immediate line, psychological and structural. A daily close below it reopens $1,980, the recent flush low, and below that the path toward $1,900 where the next meaningful support cluster sits. The RSI at 32.50 is not yet at the extreme readings that historically signal genuine capitulation. The low-2,000s, where ETH bottomed in late March, represent that level, and there is space between here and there. Adding to the bearish case: CryptoQuant’s analysis notes that historically, whenever ETH has sustained a prolonged tight range like the current one, the resolution has more frequently been a downside breakout than an upside one.
If something changes, the setup for a sharp recovery is more developed than it appears. The overleveraged longs have been flushed. ETH supply on Binance is at a multi-year low. Stablecoin balances are at a six-week high. And there is a fundamental catalyst on the horizon that the current war narrative has largely buried: the Glamsterdam upgrade, Ethereum’s most significant technical overhaul since the Merge, is targeting a June 2026 launch. ETH has front-run every major upgrade in its history, rallying approximately 35% before the Merge, 40% before the Shanghai upgrade, and 20% before Dencun. If that pattern holds, the accumulation window typically opens six to eight weeks before the go-live date, meaning it opens now, in conditions that feel like the worst possible time to buy.
That tension – between what the price is doing and what the structure is building, is the honest read of this market. The chart points down. The reserves point toward a recovery. Which one speaks first depends on whether the war in the Middle East gets louder or quieter in the days ahead.
The information provided in this article is for educational purposes only and does not constitute financial, investment, or trading advice. Coindoo.com does not endorse or recommend any specific investment strategy or cryptocurrency. Always conduct your own research and consult with a licensed financial advisor before making any investment decisions.