

Five separate Binance datasets are pointing in the same direction simultaneously. Here is what the data actually shows.
What the Chart Shows – and Why Binance Specifically
Bitcoin is at $72,750 on Binance, holding just below the session high of $72,777, after it broke above $73,000 yesterday, following the CPI data. The 50 SMA sits at $72,195, rising, and now acting as support after price crossed above it during the April 8 ceasefire spike. The RSI is at 53.23 with the signal line at 58.70. Both readings are in neutral-to-bullish territory, momentum pulled back from the recent high without reaching overbought and is consolidating.
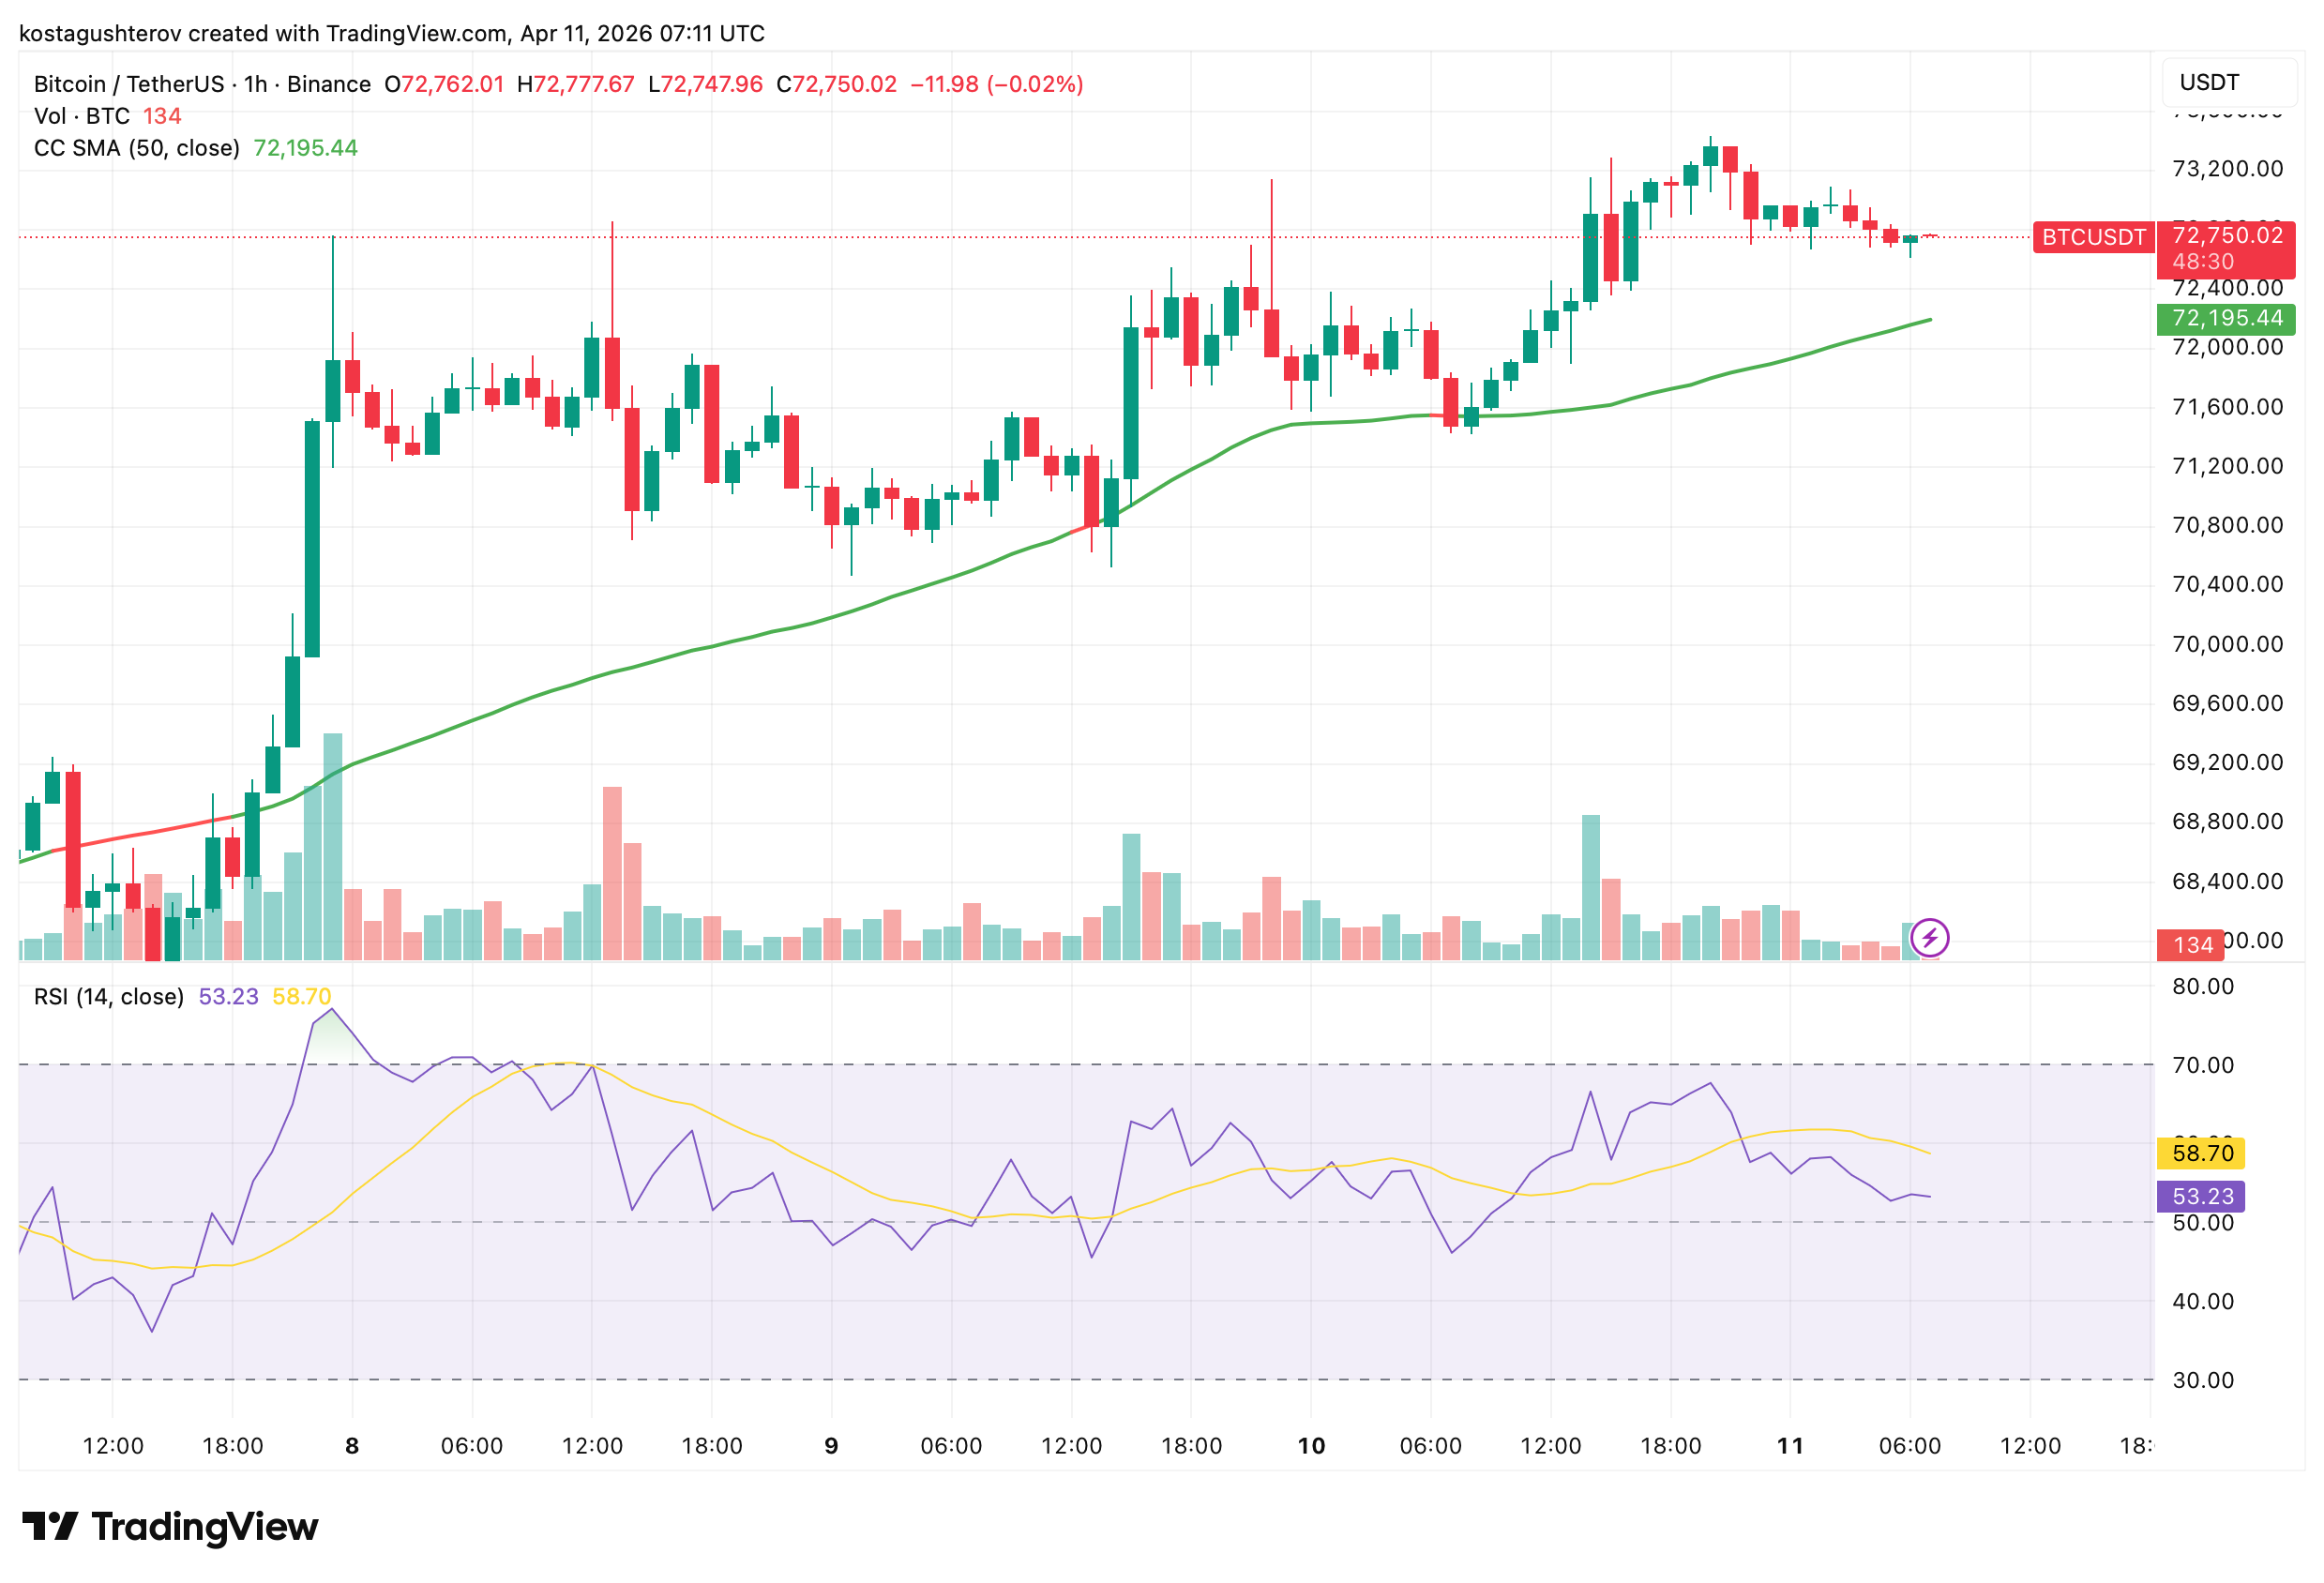
The structure since April 8 is the key observation. The ceasefire spike drove price from $68,900 to $72,400 on the largest volume bar visible on the chart. The pullback found support at $70,800, a higher low. Price has since recovered to $72,777, a higher high. Higher low, higher high, rising 50 SMA beneath it. That is a constructive structure regardless of what the macro environment is doing around it.
Binance is the right lens for this analysis because it is where price direction is being set. Of all major exchanges, Binance shows the highest and most consistent correlation between open interest and price movements, OI expanding and contracting in real-time sync with price, not lagging it. Data from CryptoQuant that follows is Binance-specific because that is where the positioning that drives Bitcoin’s price is actually happening.

The Inflow Collapse That Changes the Supply Picture
Binance exchange inflows peaked on April 8 at approximately 4,900 BTC, the highest reading across the visible period, coinciding with the ceasefire announcement. That figure represents the maximum supply pressure the market faced during the rally. Since then inflows have declined steadily: 3,550 on April 9, 3,350 on April 10, and 842 on April 11, a collapse to roughly one-sixth of the peak level.

Price has not followed those inflows lower. It has held above $72,000 while the supply arriving to sell has evaporated. When exchange inflows decline while price stays elevated, the sellers who were sending BTC to exchanges have largely finished. The distribution pressure that accompanied the ceasefire spike is fading. What remains is a market sitting above $72,000 with significantly less overhead supply than it faced three days ago.
What the Squeeze Risk Oscillator Is Saying
The Binance Squeeze Risk Oscillator SMA-14 is at -0.32. The key reference levels are +0.80 for Short Exhaustion and -0.80 for Long Exhaustion. At -0.32 the oscillator expelled sellers without approaching the long exhaustion zone that precedes sharp reversals. There is room between the current reading and that ceiling, room the market has not yet used.

The MVRV Adaptive Z-Score at -1.41 has crossed above its 30-day SMA of -1.66. That crossing historically signals the probability of new lows has dropped sharply, and unlike the oscillator reading, which measures short-term squeeze dynamics, the MVRV reading operates on a 365-day window. It is telling the same story on a longer timeframe. The Stablecoin Supply Ratio at 10.62 confirms what that longer view implies: buying power is sitting on the sideline, intact, and held by entities that have not needed to deploy it yet. Those entities are who the next section identifies.
Who Is Actually Running This Rally
The stablecoin reserve is available because the entity holding it has not needed to use it. The Binance Whale Concentration Ratio at 79.43% identifies who that entity is. The Binance USDT Exchange Reserve at $2.4586 billion is the firepower sitting behind that concentration, available to absorb any selling that emerges at higher levels.
A retail-driven top looks different. It shows broad participation across exchanges, fragmented OI correlation, and the Squeeze Risk Oscillator approaching the Long Exhaustion ceiling. None of those conditions are present. What is present is a whale-guided move with sellers largely cleared, stablecoin reserves intact, and Binance dominating the price discovery process across the entire derivatives market.
Five datasets without a single contradictory signal is not a common configuration. Historically when Binance whale concentration exceeds 79%, stablecoin reserves remain intact, and the Squeeze Risk Oscillator stays below long exhaustion, the path of least resistance is higher until one of those conditions changes. The next meaningful test is $75,000, where short squeeze conditions emerge and trapped short sellers become the fuel for the next leg. None of the current data suggests that test will fail before it is attempted.
The information provided in this article is for educational purposes only and does not constitute financial, investment, or trading advice. Coindoo.com does not endorse or recommend any specific investment strategy or cryptocurrency. Always conduct your own research and consult with a licensed financial advisor before making any investment decisions.

Kosta joined the team in 2021 and quickly established himself with his thirst for knowledge, incredible dedication, and analytical thinking. He not only covers a wide range of current topics, but also writes excellent reviews, PR articles, and educational materials. His articles are also quoted by other news agencies.