

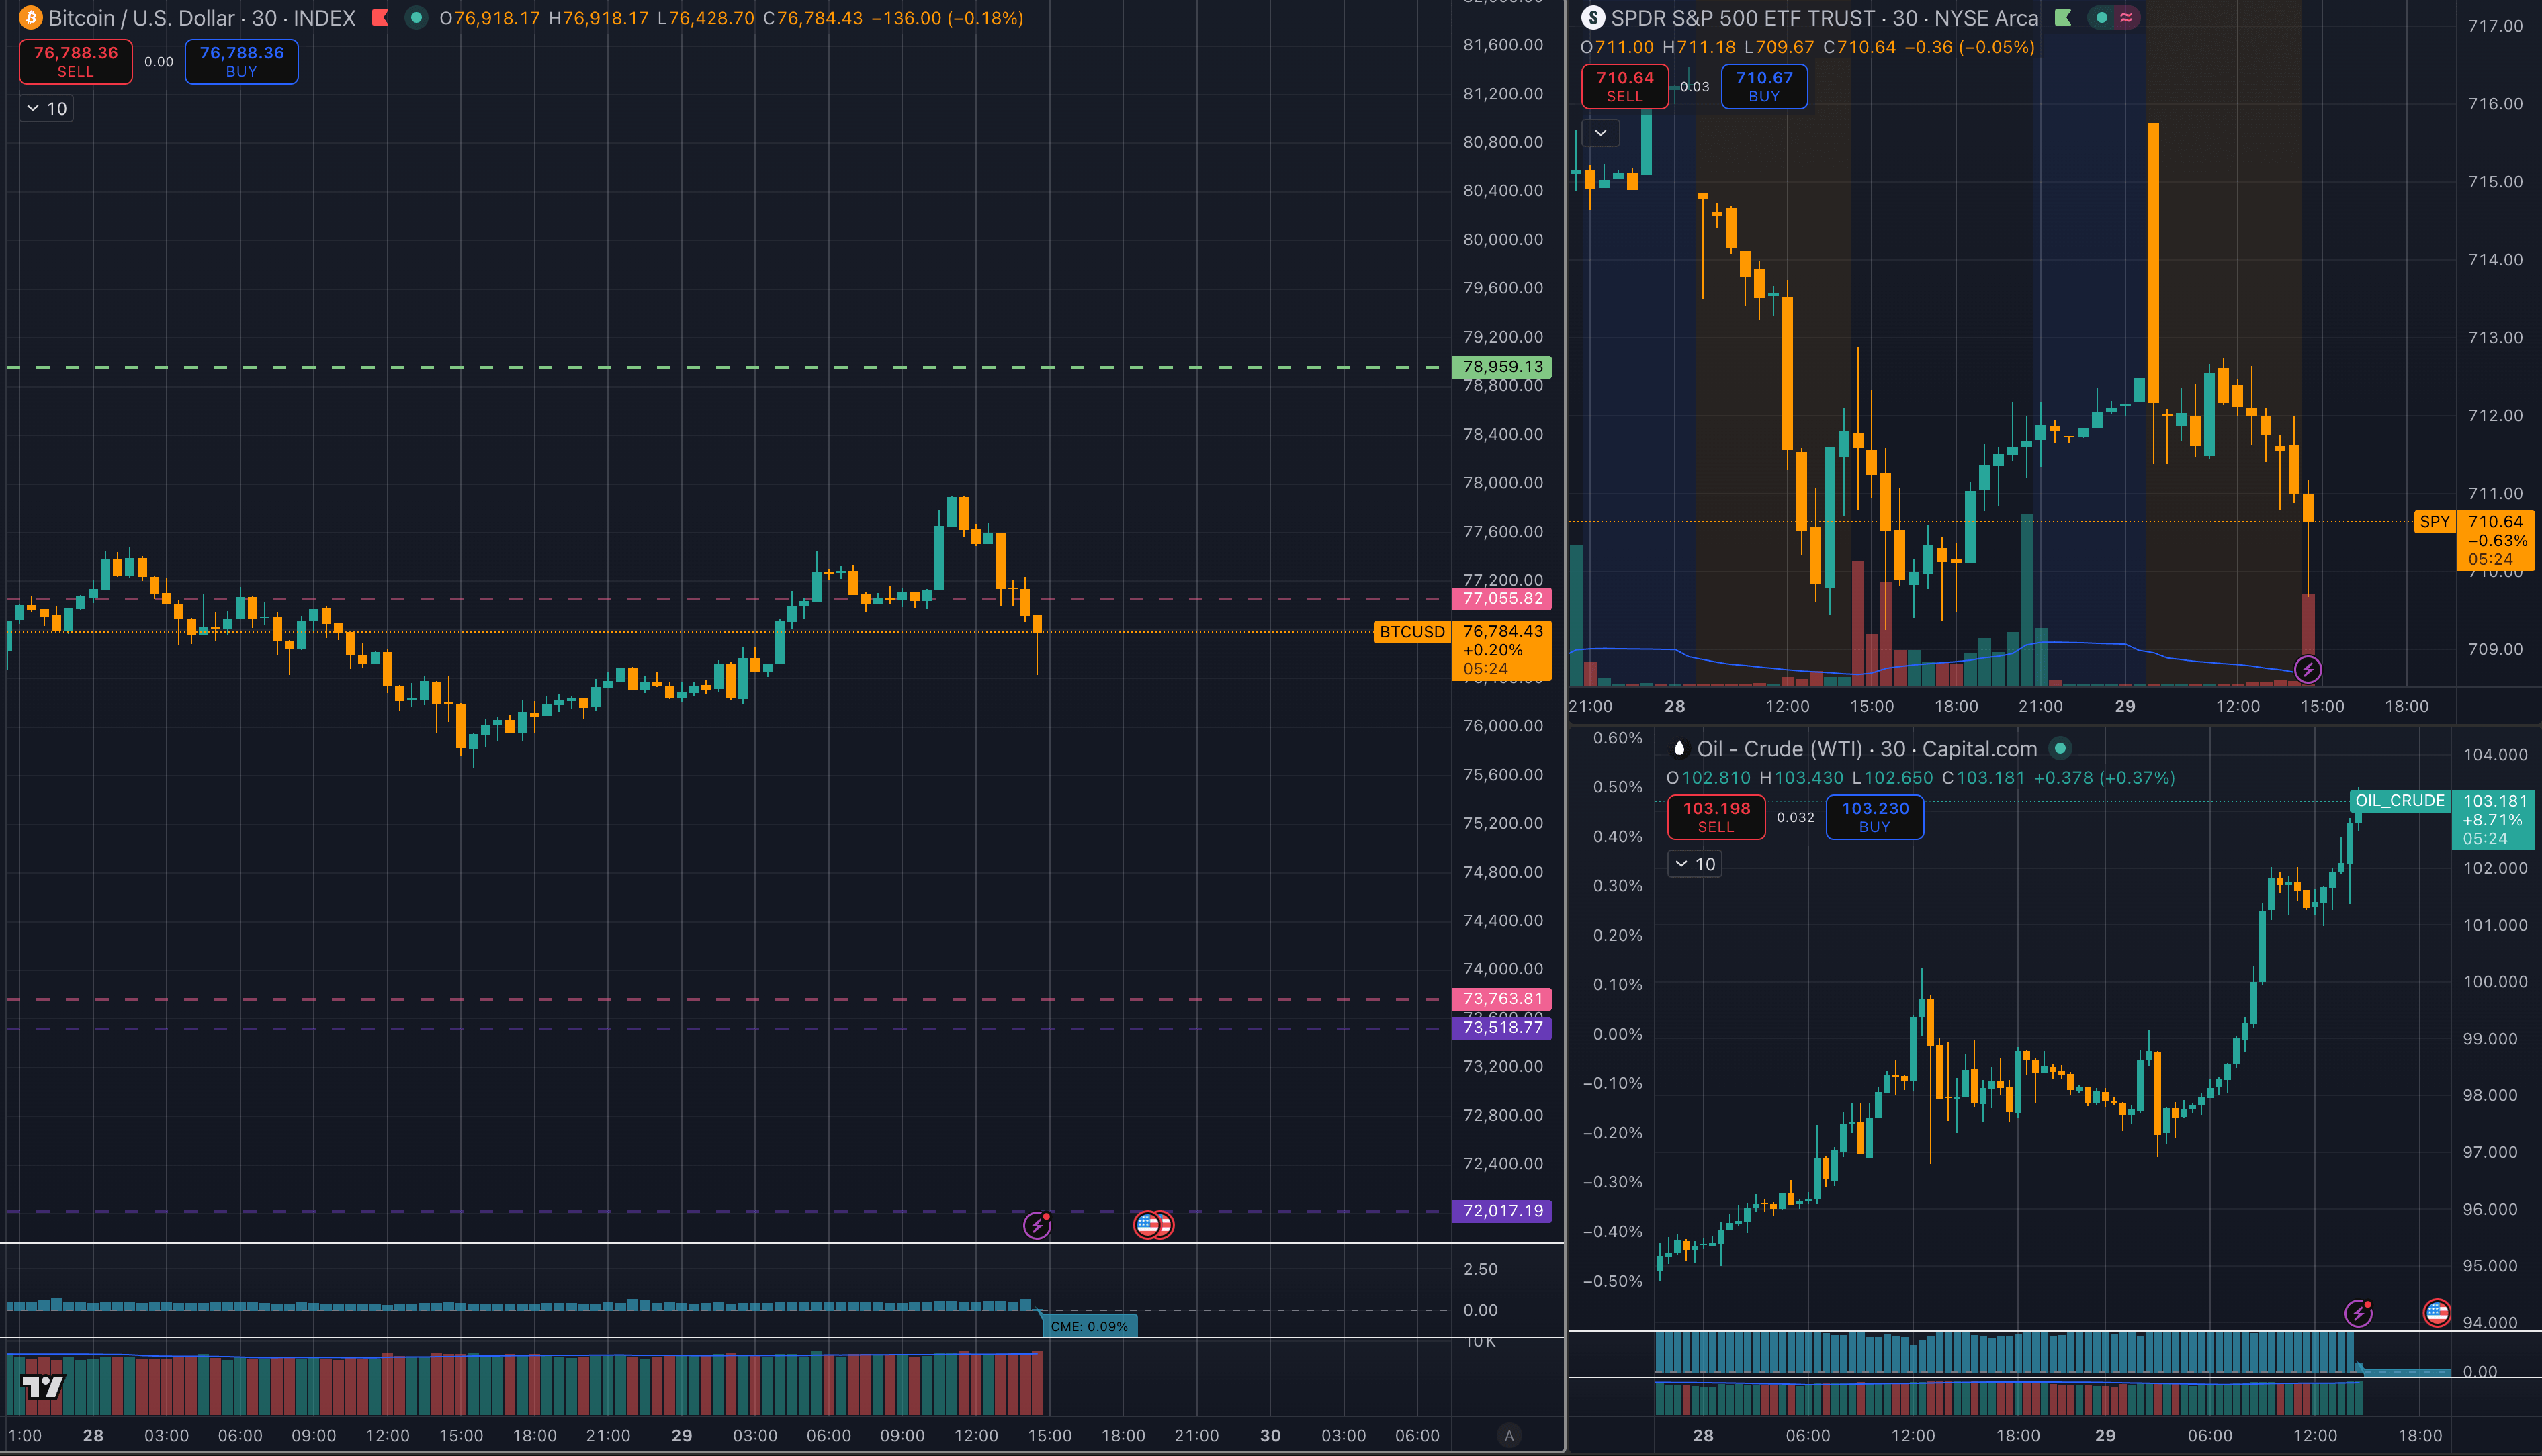
Bitcoin is trading near $76,600 after reversing from an earlier intraday push toward $78,000, while crude oil trades near $103 and the S&P 500 fell as the US stock market opened.
Before the US cash session, Bitcoin rose even as crude oil kept climbing, suggesting crypto-specific positioning was strong enough to resist the oil-inflation trade for part of the day.
After the open, the picture turned back toward equities. The chart below shows Bitcoin rolling over as the S&P 500 moved lower, while crude oil remained elevated.
That leaves two signals in tension: Bitcoin can trade independently of stocks while cash equities are closed, but US equity risk appetite can still pull it back once the main session begins.
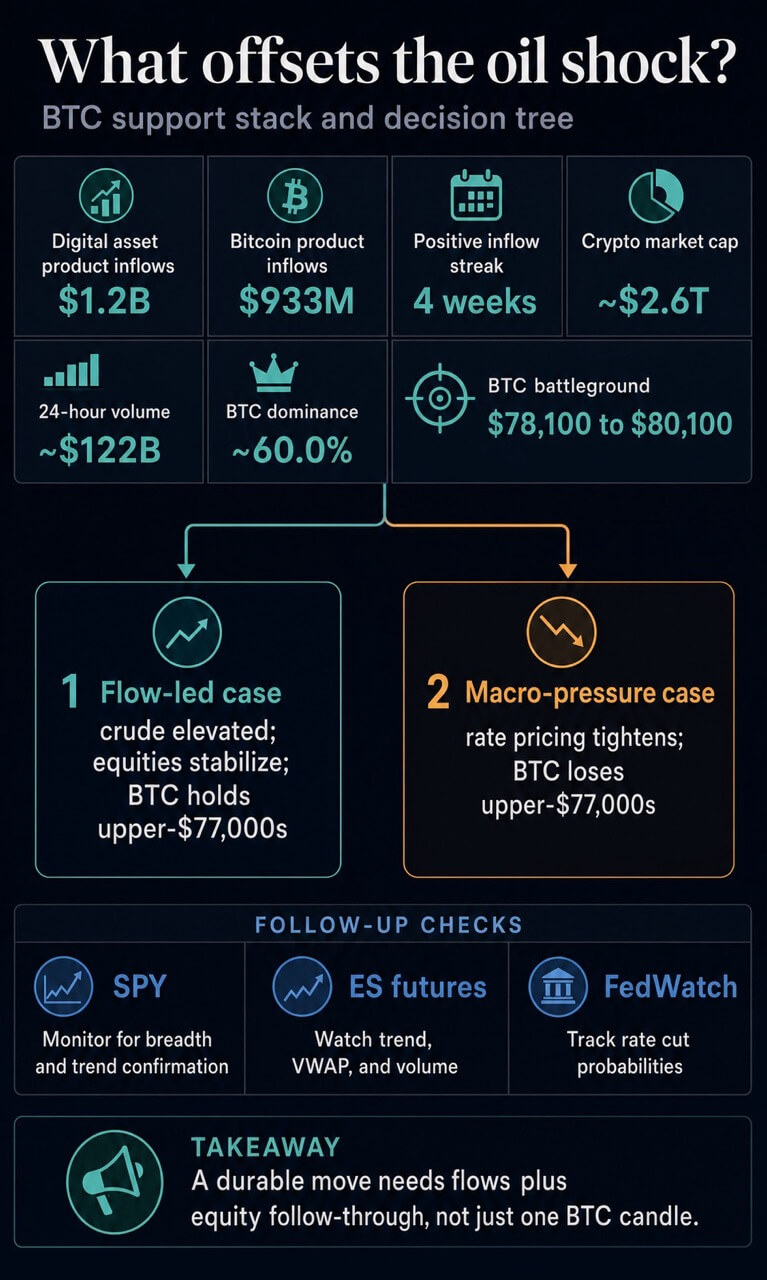
Broader market data shows roughly $2.6 trillion in crypto market cap, about $122 billion in 24-hour volume, and Bitcoin dominance near 60%.
CryptoSlate’s Bitcoin market page showed Bitcoin in the upper-$77,000s earlier today up about 1.6% over 24 hours, with market cap around $1.56 trillion. The latest chart shows why that intraday strength fell off: the US open turned the move from a simple oil-shock divergence into an equity follow-through test.
The open made equities the trigger
The first phase of the session weakened the simple April template that higher oil automatically means lower Bitcoin. Crude oil climbed through the $100 area, yet Bitcoin still moved toward $78,000 before US cash equities opened.
The second phase restored the equity branch of the trade. Once the S&P 500 fell at the open, Bitcoin slipped back toward the mid-$76,000s even as crude oil pushed higher.
Bitcoin showed it can resist the oil shock for part of a session. The same session also showed that the equity open can pull the asset back into the broader risk trade.
This is also consistent with prior CryptoSlate coverage. On Apr. 23, Bitcoin’s drop below $78,000 looked more like an equity and risk-appetite impulse than a direct oil move, because crude was comparatively flat while the S&P 500 softened.

Today’s chart adds a sharper version of that setup. Oil is rising, Bitcoin initially resisted the pressure, and the S&P 500 open then became the event that pulled Bitcoin lower.
Oil still controls the outer boundary
The oil channel has already been built into Bitcoin’s April setup. On Apr. 24, Bitcoin held near $78,000 as oil climbed past $100, turning the asset into a test of whether scarce-asset demand could survive a stronger dollar, higher real-yield pressure, and weaker liquidity conditions.

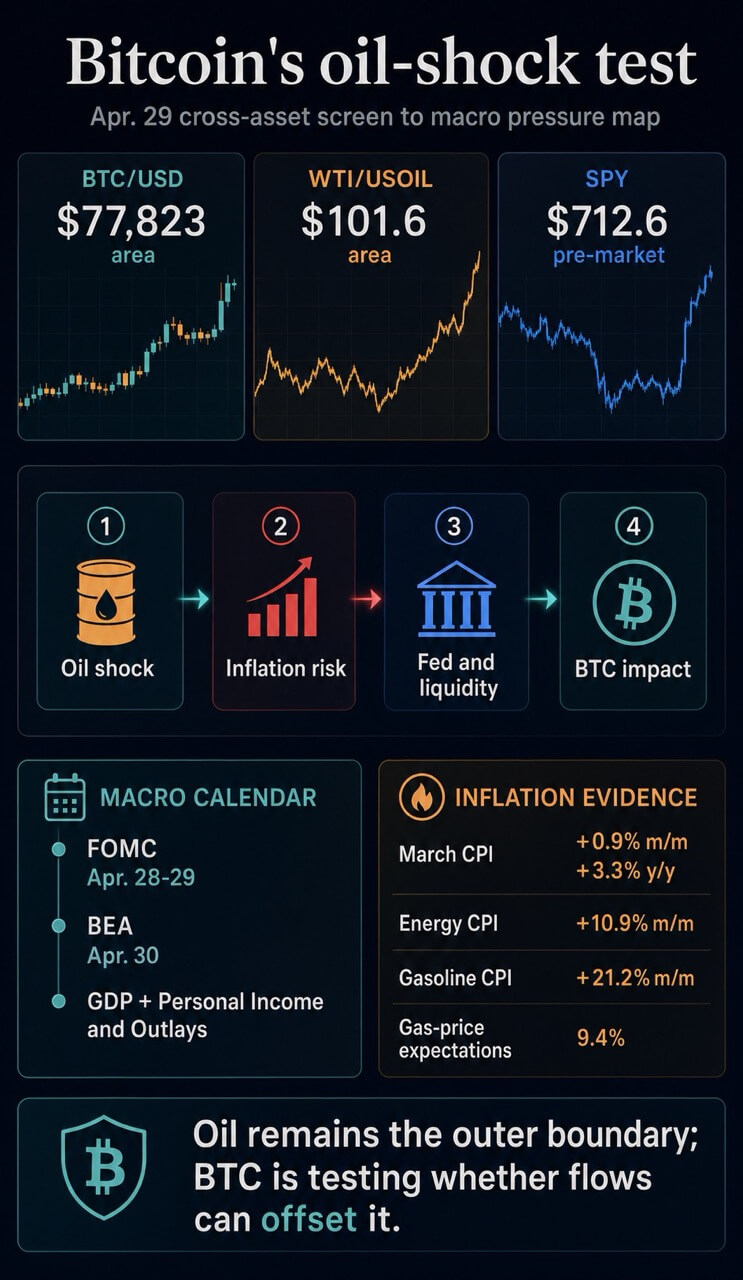
A separate analysis of the global oil shock and the Fed said fuel, freight, and input costs can move from commodity screens into realized inflation.
That channel can keep setting rates and liquidity conditions even when Bitcoin finds a short-term bid.
The official inflation data keeps that risk concrete. The Bureau of Labor Statistics said March CPI rose 0.9% from February and 3.3% from a year earlier.
Energy rose 10.9% on the month, led by a 21.2% jump in gasoline. The New York Fed’s March survey then showed year-ahead gas-price expectations at 9.4%, the highest reading since March 2022.
Energy-market structure adds another caveat. The Energy Information Administration described a wider Brent-WTI spread and disrupted navigation through the Strait of Hormuz as part of the global crude-market backdrop. Crude stress can move from commodity pricing into inflation expectations, which keeps the Fed channel open.
The calendar concentrates that pressure. The Federal Reserve calendar places the Apr. 28-29 FOMC meeting directly over this cross-asset move.
The BEA schedule lists Q1 GDP and March Personal Income and Outlays for Apr. 30. That same late-April window had already been framed as a volatility cluster around options, oil, and the Fed.
The next policy and data prints can still decide whether the oil move becomes a persistent financial-conditions problem.
Flows are the offset, equities are the confirmation
The counterweight is demand. CoinShares’ latest weekly report showed digital asset investment products taking in $1.2 billion, the fourth positive week in a row.
Bitcoin accounted for $933 million of that total. CoinShares also said the Apr. 28-29 FOMC decision was likely adding caution at the margin.
On Apr. 28, fund flows and spot demand were strong enough to rebuild the bid, but the Fed still had the next hard test.

That helps explain the pre-open resilience. Bitcoin can rise even while crude oil stays elevated when fund demand, positioning, or crypto-specific liquidity is strong enough for a session. The post-open reversal shows why that alone is incomplete.
CME’s E-mini S&P 500 futures remain a strong follow-up check for whether the equity branch supports or undermines the next Bitcoin move.
| Signal | What supports Bitcoin | What pressures Bitcoin |
|---|---|---|
| Crude and inflation | Scarce-asset demand can return during policy stress. | Higher fuel costs can lift inflation expectations, keep the Fed cautious, and tighten liquidity. |
| Flows and positioning | CoinShares reported $933 million of Bitcoin product inflows in the latest week. | Flow strength still faces the FOMC and bond-market test. |
| Equities | S&P 500 and futures follow-through would support a risk-appetite interpretation. | A weaker equity open can pull Bitcoin back into the risk-asset trade. |
The Apr. 22 setup gave this move a useful threshold. It said Bitcoin holding flat or firming around $78,000 while oil stayed high would weaken the war-era template that higher oil automatically means lower Bitcoin.
So far today, Bitcoin met that test before the US equity open and then lost momentum once the S&P 500 turned lower.
A later Apr. 28 bond-market analysis placed the Bitcoin battleground around the $78,100 to $80,100 area.
Below that zone, sellers can argue that the rally is another failed attempt into resistance. Above it, flows have a better chance of turning the recent rebound into a durable demand signal.
CME FedWatch remains the live market-implied check on how rate expectations are moving through that test.
Two scenarios follow from the updated chart. In the flow-led case, crude oil stays elevated but does not accelerate, the S&P 500 stabilizes, and Bitcoin reclaims the upper-$77,000s before testing the $78,100 to $80,100 band.
In the macro-pressure case, crude keeps inflation expectations warm, Fed pricing moves against risk assets, the S&P 500 weakens, and Bitcoin remains below the upper-$77,000s. That would restore the familiar April sequence: oil pressure first, equity stress second, Bitcoin liquidity last.
Bitcoin ignored crude oil long enough to prove the oil shock is not the only intraday force. Once the US market opened, equities became the trigger that pulled Bitcoin back. The regime test now depends on whether flows can rebuild the bid while crude oil and the Fed keep pressure on risk assets.