

Solana is testing important resistance level while the volume data raises a specific question about whether the move has the conviction to hold it.
Key Takeaways
- SOL at $86.67, Fibonacci 0.382 at $86.5.
- SMA50 at $86.47 and SMA100 at $86.10 forming support floor $0.20-$0.57 below price.
- Total compression range: $0.78 between MA floor and Fibonacci ceiling.
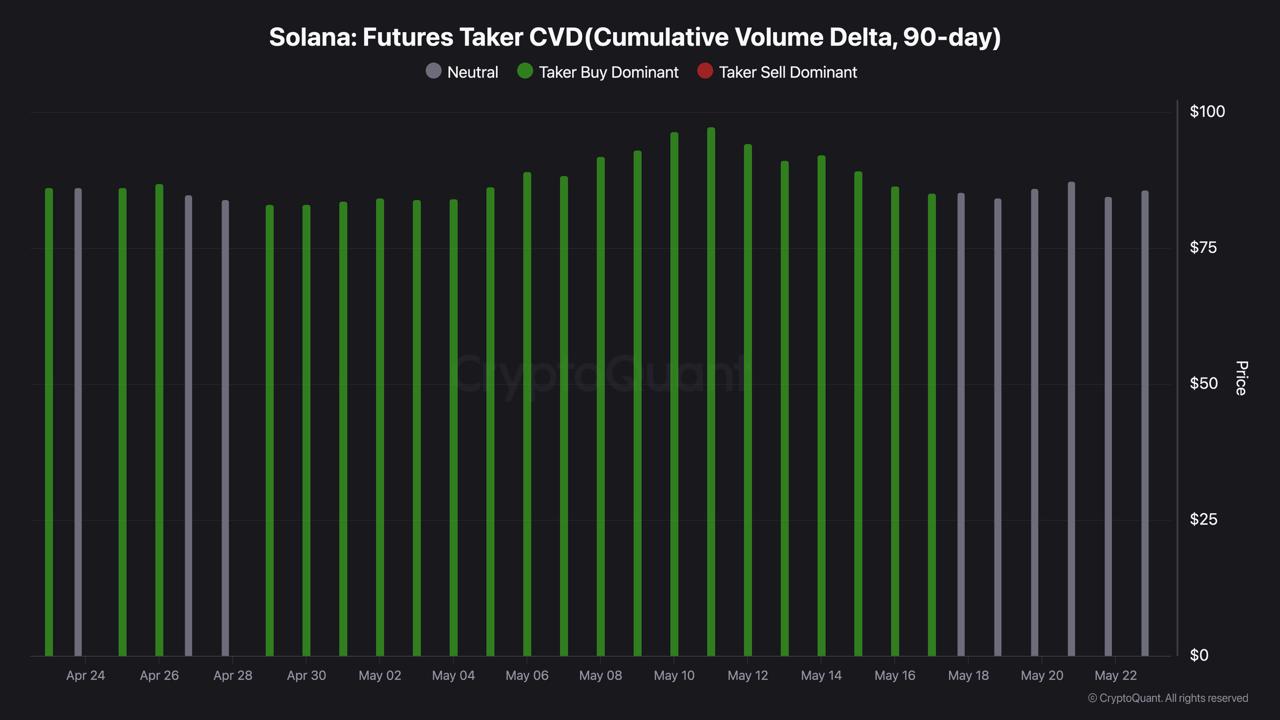
- Futures CVD: buy dominant May 6-15, returned to neutral May 16 onward.
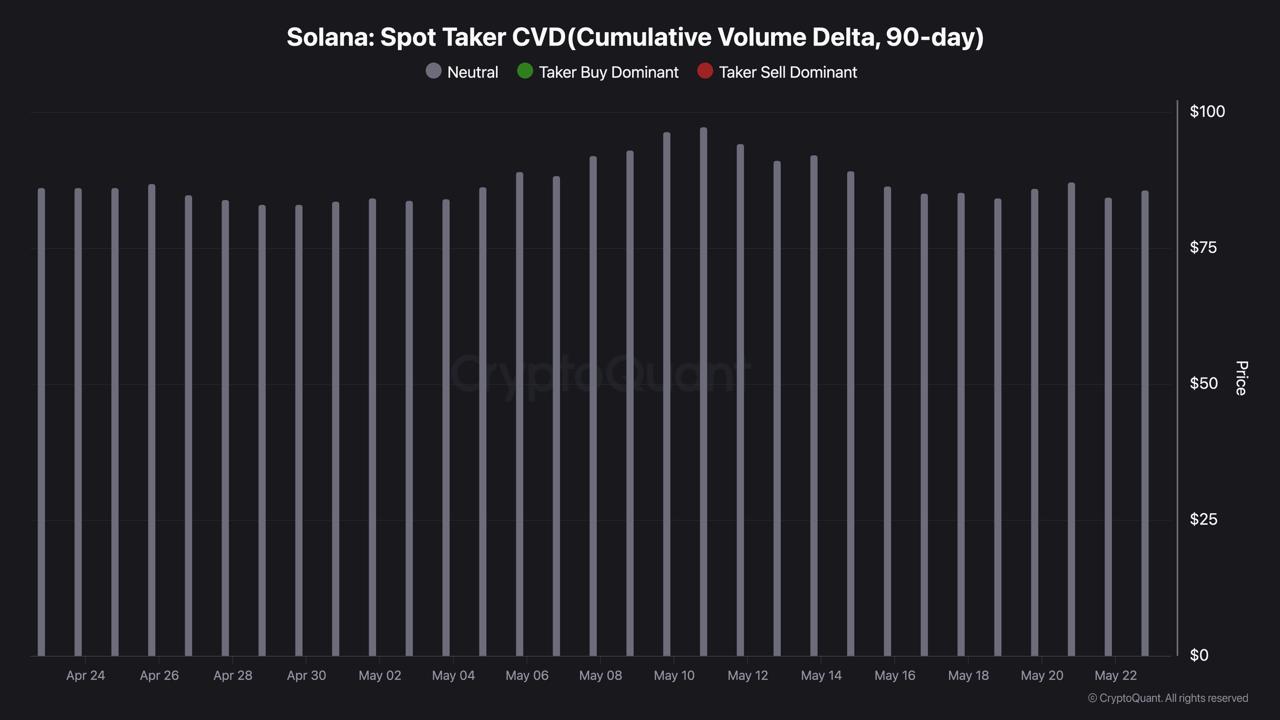
- Spot CVD: neutral throughout entire 30-day visible range.
Solana’s price compression between the Fibonacci 0.382 at $86.5 and the SMA50/SMA100 cluster at $86.10-$86.47 is occurring in a volume vacuum: both futures and spot CVD have returned to neutral after the May buying surge, meaning the price is not being held at this level by active demand but by the absence of active selling.
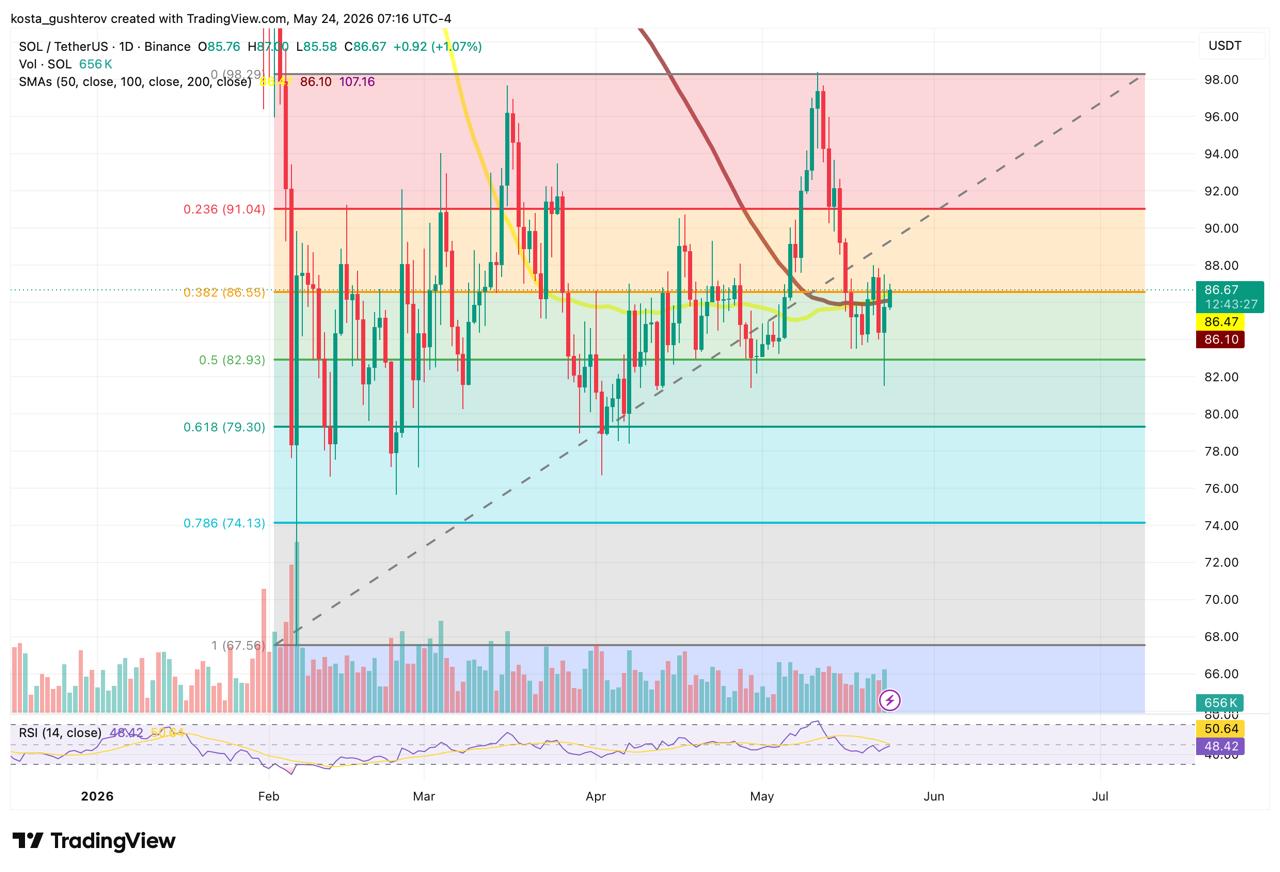
The Fibonacci 0.382 is the retracement level that separates recovery territory from deeper correction territory on this grid. The SMA50 at $86.47 and SMA100 at $86.10 have converged to within $0.37 of each other, forming a combined MA floor just below price.
The compression zone of $0.78 is analytically significant because of its location. Price is not consolidating below a resistance level waiting to break up. It is not consolidating above a support level waiting to break down. It is consolidating at the exact intersection of both, with the Fibonacci level as the ceiling and the MA cluster as the floor, and the RSI at 48.42 sitting 2.22 points below its signal line at 50.64 confirms that momentum has not yet resolved in either direction.
What the CVD Charts Say About the Buying That Got Here
The futures CVD shifting from predominantly buy-dominant in early May to neutral from May 16 onward describes a market where the leveraged conviction that drove the rally to $97 has been fully withdrawn, and the price level that remains after that withdrawal is sitting at the most structurally significant Fibonacci retracement in the current range. The futures CVD chart shows green buy-dominant bars concentrated from approximately May 6 through May 15, with the tallest bars at the May 10-11 price peak near $97. According to CryptoQuant data, from May 16 onward, the futures CVD returns to grey neutral, and the most recent days including May 22 are neutral.
The spot CVD tells a consistent story across the entire 30-day visible range: every bar is grey neutral. There has been no day in the April 24 to May 22 window where spot takers were buy-dominant on Solana. The May rally that reached $97 was a futures-led move without spot confirmation, and the current price at $86.67, after fully giving back that rally, is holding at the Fibonacci 0.382 without spot buying present.
What Needs to Happen for the Level to Hold
A daily close above $86.5 with RSI crossing above 50 would align the Fibonacci structure, the momentum indicator, and the MA support simultaneously, and that triple confirmation is what separates a genuine recovery from a temporary excursion above resistance in a neutral-volume environment. If that close occurs on expanding volume with the spot CVD turning green for the first time in the visible range, the signal carries additional structural weight. The next resistance above the 0.382 is the Fibonacci 0.236 at $91.04, approximately 4.8% above the current level.
A daily close below the SMA100 at $86.10 with both CVD charts remaining neutral would confirm the compression is resolving downward without the buying pressure to sustain the Fibonacci level. The Fibonacci 0.5 at $82.93 is the next labeled support, approximately 4.3% below current price, with no labeled intermediate level between the SMA100 and that zone.
The information provided in this article is for educational purposes only and does not constitute financial, investment, or trading advice. Coindoo.com does not endorse or recommend any specific investment strategy or cryptocurrency. Always conduct your own research and consult with a licensed financial advisor before making any investment decisions.

Kosta has reported on cryptocurrency markets and blockchain infrastructure since 2020, bringing over six years of hands-on experience in the crypto industry built through daily tracking of markets, trends, and emerging blockchain developments. Specializing in Bitcoin on-chain analysis, institutional ETF flows, and digital asset price action, his work at Coindoo has been cited by other news agencies and consistently covers market developments with a focus on data-driven reporting across Bitcoin, Ethereum, Solana, and XRP.
Over the years, Kosta has contributed to multiple crypto media outlets in different regions, authoring over 6,000 articles across the sector. His reporting spans cryptocurrency markets and the broader fintech industry, tracking not only price action but also the technological and regulatory forces shaping the ecosystem.
To support his analysis, Kosta actively leverages on-chain data and metrics from leading platforms such as Santiment, Glassnode, and CryptoQuant, enabling deeper, evidence-based market insights. He believes in the power of transparency and the data that underpins the blockchain ecosystem.
His academic background in Marketing Management from Denmark further complements his analytical approach, adding a strong understanding of communication strategy and content positioning to his work.