

Bitcoin crossed $100,000 for the first time in late 2024, hit a record above $126,000 by October 2025, and has spent the months since losing nearly half of that gain – leaving the market to debate whether the worst is already over or still ahead.
Key Takeaways:
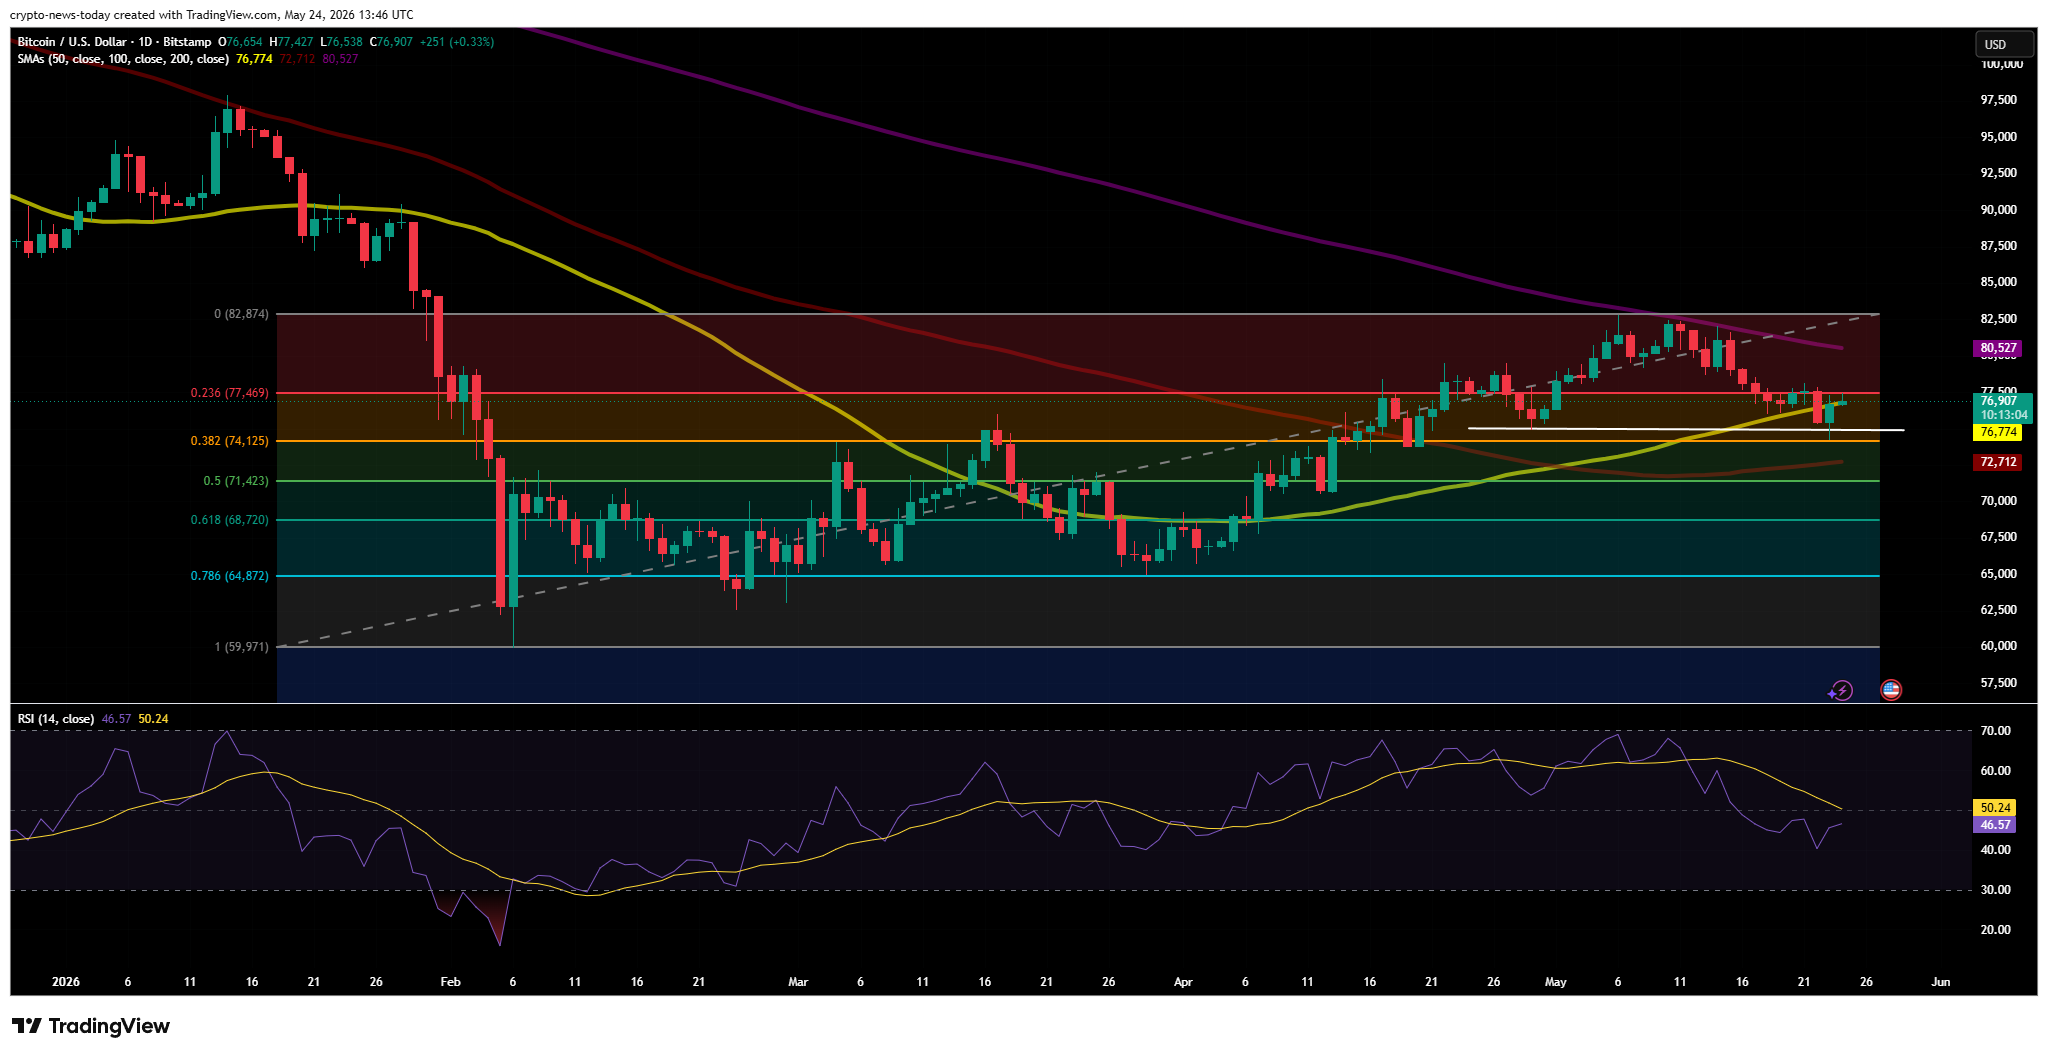
- Bitcoin is trading around $77,000, rejected sharply from the 200-day moving average at $82,000-$83,000.
- Spot ETFs recorded $2.26 billion in net outflows over two weeks, signaling fading institutional appetite.
- Perpetual swap funding rates have been negative for 81 consecutive days – traders are unusually bearish even at these price levels.
- On-chain data shows sellers historically exhaust themselves at $60,000, where 10.6 million BTC enters net loss territory.
Bitcoin has been grinding sideways between $75,000 and $80,000 for weeks, pinned below the 200-day moving average at $82,000-$83,000 – the zone where a large portion of institutional ETF buyers are sitting at breakeven and where selling pressure reliably kicks in. The asset shed roughly 40% from its October 2025 peak of $126,000 before finding a floor at $60,000 in early February 2026. Since then, the rebound has been slow, unconvincing, and twice rejected at the same ceiling. The question now dividing traders, analysts, and institutions is straightforward but unanswerable with certainty: was $60,000 the definitive cycle bottom, or is the market building toward one final capitulation?
The Unfinished Business at $60,000
From a technical standpoint, the chart offers little comfort to bulls. Michaël van de Poppe, one of the more widely followed technical analysts in the crypto space, flagged that Bitcoin had lost a critical support zone at $75,000-$76,000, noting that $76,600 needs to hold as a base for any meaningful upside momentum to build. With Bitcoin currently trading around $77,000, that level is being tested rather than confirmed, and the 200-day moving average has been sloping downward since late April – every attempt to push through it has ended with aggressive selling.
Gareth Solloway, a technical analyst with a long track record in both equities and crypto, identifies $81,000-$85,000 as a heavy resistance band that needs a clean, confirmed break before anything changes structurally. His read on the current setup is straightforward: either Bitcoin breaks lower with a minimum target of $60,000, or it clears the ascending channel around $84,000 and opens a path toward the January peak at $97,000. Until one of those scenarios plays out with conviction, he said he is in a “wait-and-see” mode.
The institutional data adds weight to the bearish side. Spot Bitcoin ETFs bled $2.26 billion in net outflows over the past two weeks, according to K33 Research. Their analysis shows that selling is concentrated right around the $82,000-$83,000 level – the average acquisition cost for a large segment of institutional participants. In practical terms, a significant group of players used the rally to exit at breakeven rather than add exposure, which tells you something about the conviction behind this recovery.
The macro backdrop is not helping. Kevin Warsh, the new Federal Reserve Chair, has been vocal about central bank independence and treating inflation as the primary mandate. Markets that had priced in a series of rate cuts under his tenure are now walking those expectations back. The most recent FOMC minutes revealed internal discussion about potential rate hikes if inflation stays above target – and higher rates mean a stronger dollar, tighter liquidity, and less tolerance for risk assets. Whatever the “digital gold” narrative says, Bitcoin still trades like a risk asset when institutional positioning actually moves.
There is also a performance gap worth noting. The Nasdaq has climbed roughly 30% from its March lows, yet Bitcoin has lagged well behind. Historically, when the tech index posts that kind of run, crypto tends to double or triple the move, with altcoins doing even more. None of that has materialized, and the underperformance is a data point that bears watching.
Why the Old Rules No Longer Apply
The counter-argument rests on data that is harder to dismiss. On May 19, K33 Research published an analysis in which Vetle Lunde documented 81 consecutive days of negative perpetual swap funding rates on Bitcoin – close to an all-time record. Put plainly, traders have been betting against Bitcoin for nearly three months straight, even with prices nowhere near the lows. This is structurally unusual. In typical bear cycles, the shorts get flushed out well before any real bottom forms and the market falls without a cushion underneath. Here, any move back toward $60,000 would trigger a wave of forced short covering that mechanically slows the descent and limits how far price can fall.
K33 nonetheless puts their base case firmly on the other side of that argument. The firm views February’s $60,000 low as the maximum drawdown for this cycle, with Vetle Lunde, the company’s head of research, noting that “the less aggressive bull market of 2025 sets the stage for a more moderate bear market in 2026” – meaning the damage is already done, and what follows is recovery, not another leg down.
At both of the previous major cycle bottoms – February 2019 and January 2022 – selling activity dried up at precisely the point where 10.6 million circulating Bitcoin were sitting at a net loss. When Bitcoin touched $60,000 on February 5, 2026, that figure stood at 9.93 million BTC. If price returns to $60,000 now, the math brings that number right up to the historical exhaustion threshold – the level where sellers have consistently stopped selling.
Michael Saylor, whose company Strategy remains the largest corporate holder of Bitcoin, described the current price environment as the “spring phase” of the cycle – following the October peak near $125,000 and the February trough at $60,000. His argument is that the credit market is now absorbing every Bitcoin miners produce, and that dynamic holds regardless of short-term price swings. Cathie Wood has also weighed in recently, arguing the market has already bottomed – for a fuller breakdown of her view on the four-year cycle and where she sees Bitcoin heading, read our article “Cathie Wood: Bitcoin Has Bottomed and the Four-Year Cycle Is Fading.”
Where Things Stand
The technical rejection at $82,000-$83,000, the ETF outflows, and the Nasdaq divergence all point to a market that has not finished digesting the damage from the October peak. At the same time, 81 days of negative funding rates and a historically reliable on-chain exhaustion metric at $60,000 suggest the floor is not as fragile as it looks. The next meaningful move – whether that is a confirmed break above $84,000 toward $97,000 or a retest of February’s low – will answer the question better than any analyst currently can. Until then, the $60,000 level stays on the map.
The information provided in this article is for educational purposes only and does not constitute financial, investment, or trading advice. Coindoo.com does not endorse or recommend any specific investment strategy or cryptocurrency. Always conduct your own research and consult with a licensed financial advisor before making any investment decisions.

Alex is Editor-in-Chief of Coindoo and co-founder of Millennial Media Group, with nearly a decade of experience covering financial markets – crypto first, then everything else.
It started in 2016 with Bitcoin. Like most people at the time, he didn’t fully understand it – so he kept digging. Blockchain, tokenomics, the projects, the cycles. That curiosity never stopped, and eventually pulled him into traditional markets too: equities, commodities, macro. Not because he left crypto behind, but because you can’t properly understand one without the other.
What drives him is straightforward: he wants to know why something is happening, not just that it’s happening. Most market coverage stops at the headline – price up, price down, here’s a chart. Alex finds that kind of reporting actively unhelpful. If you walk away from an article without understanding the mechanism behind the move, what did you actually learn?
He holds a degree in Tourism from New Bulgarian University – not the most obvious path into financial markets, but markets have a way of pulling in people who are simply too curious to stay out. He has authored over 200 in-depth analyses and more than 10,000 articles across crypto and traditional finance. He still thinks every day in markets teaches him something new. That’s probably why he hasn’t stopped.