

ETH has shed 5% in 24 hours and 10% on the week, returning to levels last seen during the February 2026 capitulation, while on-chain data reveals a deepening structural divide between its liquid and illiquid supply layers.
Key Takeaways
- 32.5% Supply Locked: 39.5M ETH staked; transfer volumes down 96%.
- February Floor Retest: Price hits crucial $1,871 capitulation low.
- $64M Daily Outflow: Binance stablecoin drain crushes exchange buying power.
- Fragile Long Base: Funding rate hits 2026 high of 0.01.
After erasing the entirety of the recovery built between March and May 2026,the TradingView daily chart shows ETH has broken beneath the Fibonacci 1.0 retracement level at $1,941, now trading clearly under it with the level flipping to overhead resistance.

The 50-day SMA sits at $2,219, the 100-day at $2,158, and the 200-day at $2,479, all positioned well above current price, confirming that ETH has broken beneath every major moving average on the daily timeframe simultaneously. The RSI reads 24.03, its most oversold reading of the current cycle, with the signal line at 32.73 still declining.
The last time ETH traded at these levels was February 2026, when the asset bottomed near $1,816 before staging a recovery toward $2,500. Whether current price action constitutes a retest of that floor or a breakdown through it depends on what the next daily close delivers relative to the $1,800 horizontal support visible on the chart.
Zooming out to the monthly chart adds a structurally significant data point. The ascending trendline connecting Ethereum’s lows since early 2022, a support structure that held through two major corrections over four years, has been broken to the downside on the current monthly candle.
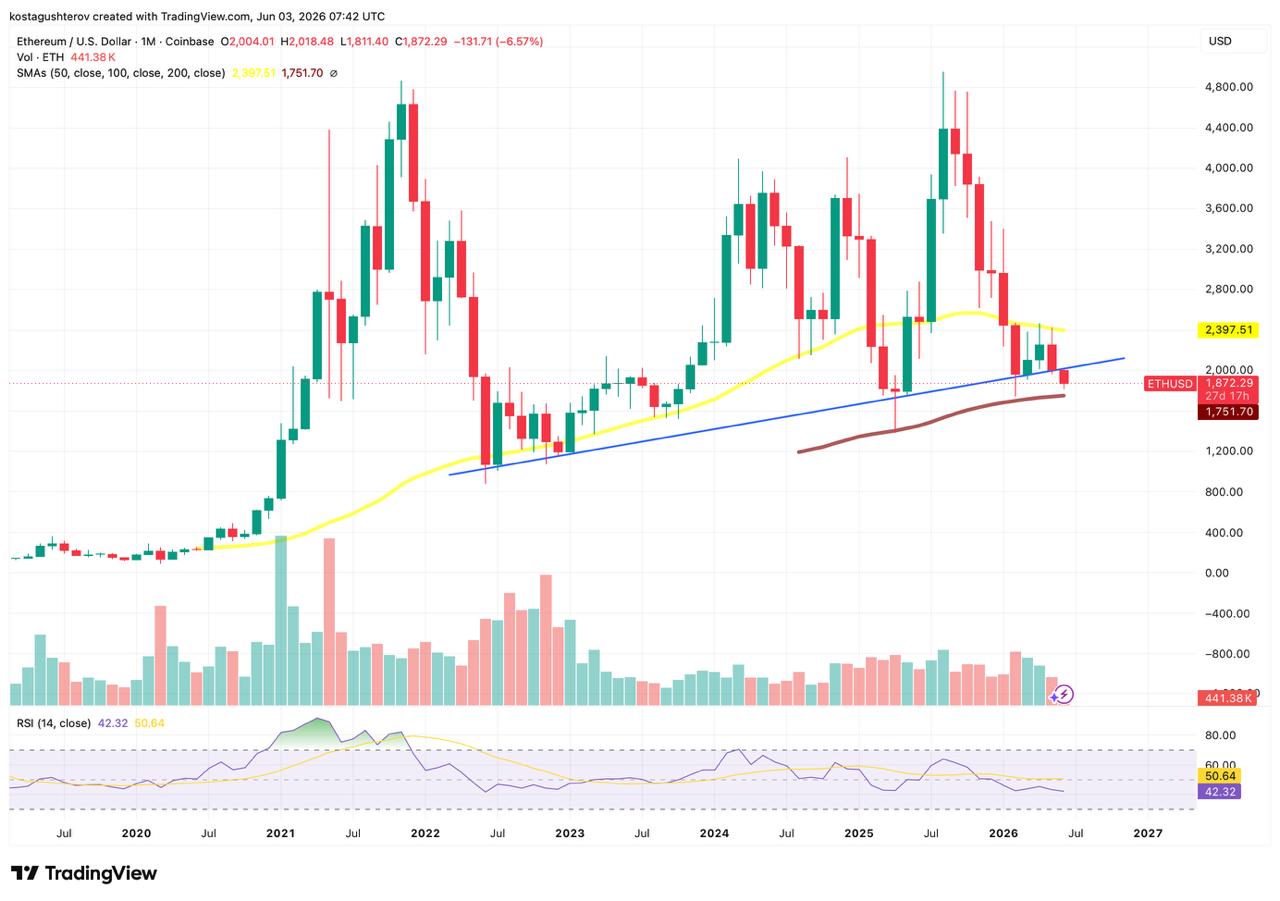
Each previous test of that trendline on the monthly timeframe produced a recovery, with the 2022 bear market low, the 2023 accumulation base, and the 2024 correction all finding support along it before price resumed higher. May 2026 closed exactly on the trendline, a final technical test that the market initially passed.
This is not the first time Ethereum has tested the trendline from below. A prior monthly candle produced a wick beneath it, with price briefly trading under the level intraday before buyers reclaimed it and the candle body closed above, leaving the trendline intact. That distinction matters technically: a wick signals a test, a body close signals a verdict. The current June candle is so far printing a body below the trendline, not just a wick, which makes it structurally more significant than any previous test. However, it is only June 3, meaning the monthly candle has the remainder of the month to recover. A body close back above the trendline by June 30 would follow the same pattern as the prior wick rejection and neutralize the breakdown signal entirely. A body close below it would confirm the first real violation since the trendline was established in 2022, shifting the 200-month SMA at $1,751 into the primary structural reference below current price. The June monthly close is now one of the most important medium-term data points for Ethereum’s structure.
The Supply Divide: Liquid Market Tightening as Staking Expands
Report shared by CryptoQuant confirms that Ethereum’s on-chain structure is splitting into two distinct behavioral layers. More than 32.5% of total ETH supply, roughly 39.5 million ETH, is now staked and effectively removed from active market circulation. Exchange reserves are declining in parallel, meaning the pool of ETH available for immediate spot trading is contracting even as price falls.

This matters because a tightening liquid supply does not automatically arrest a price decline in the short term. What it does is alter the structural conditions under which selling pressure operates. With over one-third of supply locked in staking and exchange reserves shrinking, the remaining liquid market becomes increasingly sensitive to directional flows. Spot selling of even moderate size can produce outsized price moves when the available float is this constrained.
Median on-chain transfer value has fallen approximately 96% below its 90-day baseline. That is not a panic signal. It suggests the majority of ETH holders have migrated assets into staking contracts and stepped back from active trading entirely, leaving a thinner and more reactive liquid layer to absorb whatever selling pressure emerges from those who remain active.
Purchasing Power Drain: Binance Stablecoin Netflows
Compounding the supply picture, according to the report, Binance stablecoin netflows have averaged -$64 million per day. Stablecoin outflows from an exchange reduce the purchasing power available to absorb sell orders. Dry powder, in market terms, refers to uninvested capital sitting ready to deploy into spot purchases. When that capital leaves the exchange in stablecoin form at a sustained daily rate, the available buying capacity at any given price level shrinks, making it harder for demand to absorb incoming supply without price moving lower to find the next willing buyer.
When stablecoin reserves leave Binance at this rate while ETH spot selling continues, the bid side of the order book thins without the capital needed to hold price. The combination of declining stablecoin inflows and contracting liquid ETH supply creates a structural environment where price becomes more sensitive to relatively small sell orders, which correlates with the sharp moves visible on the current daily chart.
Funding Rates: What 0.01 on Binance Actually Signals
CryptoQuant’s Ethereum Funding Rates chart for Binance confirms the rate has reached 0.01, the highest reading since the beginning of 2026. To understand what this means structurally, funding rates in perpetual futures markets represent the periodic payment exchanged between long and short position holders. When the rate is positive, long position holders pay short holders, which happens when the perpetual contract price trades above the spot price. A rate of 0.01 indicates that longs are paying shorts at a meaningful premium, reflecting significant crowding on the long side of the derivatives market.

The chart shows that from February 2026 onward, funding rates oscillated predominantly into negative territory, tracking ETH’s sustained price decline from above $3,000 toward current levels. The sudden spike back to 0.01 in early June 2026 represents an unusual divergence: price is at its lowest point since February, yet the derivatives market is more long-crowded than at any point since January 2026. That divergence implies a large cohort of traders is using leverage to bet on a near-term rebound from what they perceive as a floor, despite the absence of any confirming price action to support that thesis.
This setup carries a specific risk. When funding rates are elevated and price continues to decline rather than rebound, leveraged long positions accumulate losses and eventually face forced liquidation. Each forced close adds spot selling pressure, which pushes price lower, which forces additional liquidations. CryptoQuant data confirms short liquidations across all exchanges have fallen 85% and remain near zero, indicating the current weakness is not being driven by aggressive short sellers. It is genuine spot selling meeting an overleveraged long base, a combination that historically correlates with sharp secondary moves lower if price fails to hold current support levels.

What It All Means at $1,871
Taken together, the data describes an asset under genuine spot selling pressure, not speculative short attack. The liquid market is structurally thinner than at any point in the current cycle, stablecoin purchasing power is leaving the exchange at a steady rate, and the traders who are stepping in to buy the dip are doing so with leverage rather than spot capital. That combination is fragile. It means a recovery, if it comes, would need to be demand-driven from spot buyers absorbing the remaining sell flow, not from a short squeeze, since shorts are near absent. And it means that if spot demand does not show up at current levels, the crowded long base becomes the next source of forced selling rather than a stabilizing force.
If the $1,800 level fails to hold as support on a daily close basis, the next visible level on the chart sits at the $1,617 Fibonacci 1.618 extension level, with no demand zone of significance between current price and that level.
The information provided in this article is for educational purposes only and does not constitute financial, investment, or trading advice. Coindoo.com does not endorse or recommend any specific investment strategy or cryptocurrency. Always conduct your own research and consult with a licensed financial advisor before making any investment decisions.

Kosta has reported on cryptocurrency markets and blockchain infrastructure since 2020, bringing over six years of hands-on experience in the crypto industry built through daily tracking of markets, trends, and emerging blockchain developments. Specializing in Bitcoin on-chain analysis, institutional ETF flows, and digital asset price action, his work at Coindoo has been cited by other news agencies and consistently covers market developments with a focus on data-driven reporting across Bitcoin, Ethereum, Solana, and XRP.
Over the years, Kosta has contributed to multiple crypto media outlets in different regions, authoring over 6,000 articles across the sector. His reporting spans cryptocurrency markets and the broader fintech industry, tracking not only price action but also the technological and regulatory forces shaping the ecosystem.
To support his analysis, Kosta actively leverages on-chain data and metrics from leading platforms such as Santiment, Glassnode, and CryptoQuant, enabling deeper, evidence-based market insights. He believes in the power of transparency and the data that underpins the blockchain ecosystem.
His academic background in Marketing Management from Denmark further complements his analytical approach, adding a strong understanding of communication strategy and content positioning to his work.