

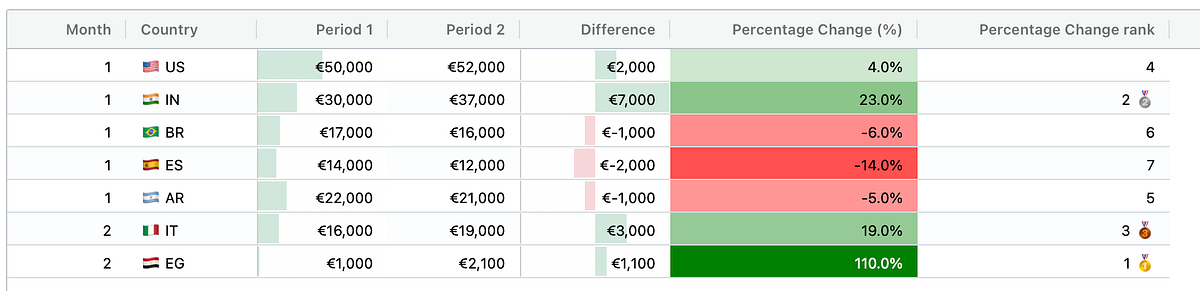
The pandas Styler is cool. But AgGrid is way cooler. Make your Streamlit dataframes interactive and stunning.


In my previous post, we covered how to create pretty styled dataframes using the pandas Styler object. In this post, I want to tell you about a second option: Streamlit AgGrid. I will share how to build dataframes like the one displayed above. After reading this post you will learn:
- The key components inside AgGrid. These are
gridOptions(),configure_column(),configure_default_column(), andconfigure_side_bar(). - The main options to enable filtering and aggregating tables using the directly the UI. No more building ad-hoc queries for simple transformations!
- Making the dataframe prettier with Javascript functions. You will be able to copy paste them in your code if you want. Or check my Git repo.
Disclaimer 1: I have no affiliation or partnership with AgGrid. I just find a lot of value in the open-source product. AgGrid does have a paid tiered product, but the blog will only use the free components of AgGrid.
Disclaimer 2: All images and GIFs are authored by myself unless specified otherwise.