

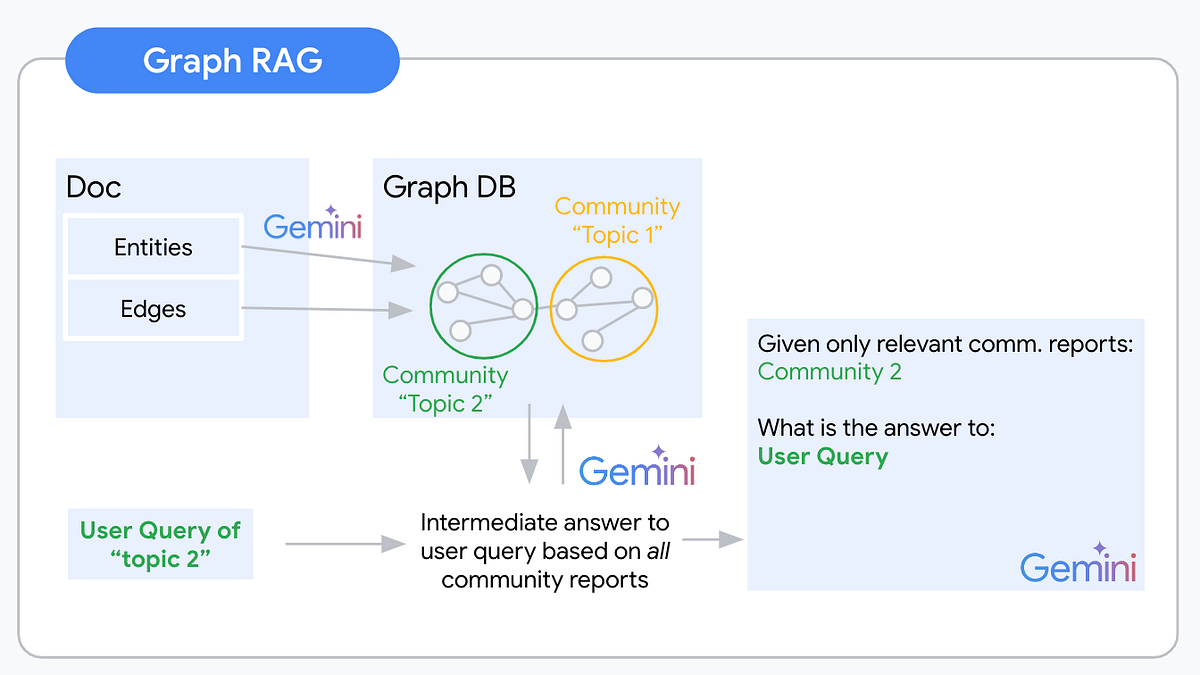
The process of building abstracted understanding for our unstructured knowledge base begins with extracting the nodes and edges that will build your knowledge graph. You automate this extraction via an LLM. The biggest challenge of this step is deciding which concepts and relationships are relevant to include. To give an example for this highly ambiguous task: Imagine you are extracting a knowledge graph from a document about Warren Buffet. You could extract his holdings, place of birth, and many other facts as entities with respective edges. Most likely these will be highly relevant information for your users. (With the right document) you could also extract the color of his tie at the last board meeting. This will (most likely) be irrelevant to your users. It is crucial to specify the extraction prompt to the application use case and domain. This is because the prompt will determine what information is extracted from the unstructured data. For example, if you are interested in extracting information about people, you will need to use a different prompt than if you are interested in extracting information about companies.
The easiest way to specify the extraction prompt is via multishot prompting. This involves giving the LLM multiple examples of the desired input and output. For instance, you could give the LLM a series of documents about people and ask it to extract the name, age, and occupation of each person. The LLM would then learn to extract this information from new documents. A more advanced way to specify the extraction prompt is through LLM fine-tuning. This involves training the LLM on a dataset of examples of the desired input and output. This can cause better performance than multishot prompting, but it is also more time-consuming.
Here is the Microsoft graphrag extraction prompt.
You designed a solid extraction prompt and tuned your LLM. Your extraction pipeline works. Next, you will have to think about storing these results. Graph databases (DB) such as Neo4j and Arango DB are the straightforward choice. However, extending your tech stack by another db type and learning a new query language (e.g. Cypher/Gremlin) can be time-consuming. From my high-level research, there are also no great serverless options available. If handling the complexity of most Graph DBs was not enough, this last one is a killer for a serverless lover like myself. There are alternatives though. With a little creativity for the right data model, graph data can be formatted as semi-structured, even strictly structured data. To get you inspired I coded up graph2nosql as an easy Python interface to store and access your graph dataset in your favorite NoSQL db.
The data model defines a format for Nodes, Edges, and Communities. Store all three in separate collections. Every node, edge, and community finally identify via a unique identifier (UID). Graph2nosql then implements a couple of essential operations needed when working with knowledge graphs such as adding/removing nodes/edges, visualizing the graph, detecting communities, and more.

Once the graph is extracted and stored, the next step is to identify communities within the graph. Communities are clusters of nodes that are more tightly connected than they are to other nodes in the graph. This can be done using various community detection algorithms.
One popular community detection algorithm is the Louvain algorithm. The Louvain algorithm works by iteratively merging nodes into communities until a certain stopping criterion is met. The stopping criterion is typically based on the modularity of the graph. Modularity is a measure of how well the graph is divided into communities.
Other popular community detection algorithms include:
- Girvan-Newman Algorithm
- Fast Unfolding Algorithm
- Infomap Algorithm
Now use the resulting communities as a base to generate your community reports. Community reports are summaries of the nodes and edges within each community. These reports can be used to understand graph structure and identify key topics and concepts within the knowledge base. In a knowledge graph, every community can be understood to represent one “topic”. Thus every community might be a useful context to answer a different type of questions.
Aside from summarizing multiple nodes’ information, community reports are the first abstraction level across concepts and documents. One community can span over the nodes added by multiple documents. That way you’re building a “global” understanding of the indexed knowledge base. For example, from your Nobel Peace Prize winner dataset, you probably extracted a community that represents all nodes of the type “Person” that are connected to the node “Nobel Peace prize” with the edge description “winner”.
A great idea from the Microsoft Graph RAG implementation are “findings”. On top of the general community summary, these findings are more detailed insights about the community. For example, for the community containing all past Nobel Peace Prize winners, one finding could be some of the topics that connected most of their activism.
Just as with graph extraction, community report generation quality will be highly dependent on the level of domain and use case adaptation. To create more accurate community reports, use multishot prompting or LLM fine-tuning.
Here the Microsoft graphrag community report generation prompt.
At query time you use a map-reduce pattern to first generate intermediate responses and a final response.
In the map step, you combine every community-userquery pair and generate an answer to the user query using the given community report. In addition to this intermediate response to the user question, you ask the LLM to evaluate the relevance of the given community report as context for the user query.
In the reduce step you then order the relevance scores of the generated intermediate responses. The top k relevance scores represent the communities of interest to answer the user query. The respective community reports, potentially combined with the node and edge information are the context for your final LLM prompt.
Text2vec RAG leaves obvious gaps when it comes to knowledge base Q&A tasks. Graph RAG can close these gaps and it can do so well! The additional abstraction layer via community report generation adds significant insights into your knowledge base and builds a global understanding of its semantic content. This will save teams an immense amount of time screening documents for specific pieces of information. If you are building an LLM application it will enable your users to ask the big questions that matter. Your LLM application will suddenly be able to seemingly think around the corner and understand what is going on in your user’s data instead of “only” quoting from it.
On the other hand, a Graph RAG pipeline (in its raw form as described here) requires significantly more LLM calls than a text2vec RAG pipeline. Especially the generation of community reports and intermediate answers are potential weak points that are going to cost a lot in terms of dollars and latency.
As so often in search you can expect the industry around advanced RAG systems to move towards a hybrid approach. Using the right tool for a specific query will be essential when it comes to scaling up RAG applications. A classification layer to separate incoming local and global queries could for example be imaginable. Maybe the community report and findings generation is enough and adding these reports as abstracted knowledge into your index as context candidates suffices.
Luckily the perfect RAG pipeline is not solved yet and your experiments will be part of the solution. I would love to hear about how that is going for you!