

Check out part 1 of this blog post series Kickstart Your ML Journey: Scoping, Structuring, and Exploring Data (Part 1) to understand the data and the business problem we are trying to solve.
Items covered in this post:
- Adding geo map features to the NYC taxi trip dataset
- Creating an interactive plot using Bokeh
- Deploying the bokeh plots to streamlit (https://nyc-taxi-trip-pp.streamlit.app/) — NOTE: use dark theme
Github link: Source code for this post
For this particular post, we are covering the following two topics of the business problem:
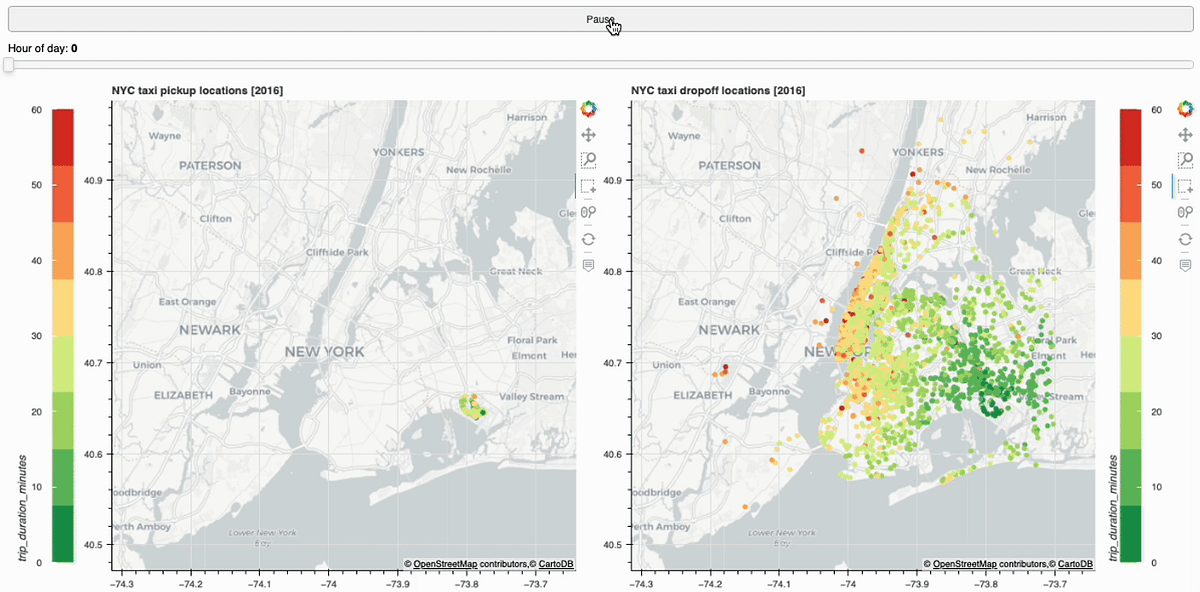
- Identify the movement of people (in taxis) across the NY city at different hours of the day.
- Identify the demand for taxi at different times in different parts of the city (where are the hot spots?).
As part of this, we will create an interactive visualization, with two options, which show:
- Scatter plot: Each trip…