

Solana builds a textbook accumulation rectangle, backed by institutional ETF buying – but the $92 breakout remains unconfirmed.
Key Takeaways
- Solana lost nearly 70% from its September 2024 highs.
- Accumulation rectangle forming since mid-February with ceiling at $92.88.
- Short-term uptrend channel forming since April, testing $92.88 resistance.
- 50MA crossing above 100MA.
- Key resistance: $92.8, with 100MA at $97.34 above.
- Key support: $77, floor of the accumulation rectangle.
- ETF inflow data confirms institutional accumulation during the rectangle formation.
A Steep Downtrend, Then Silence
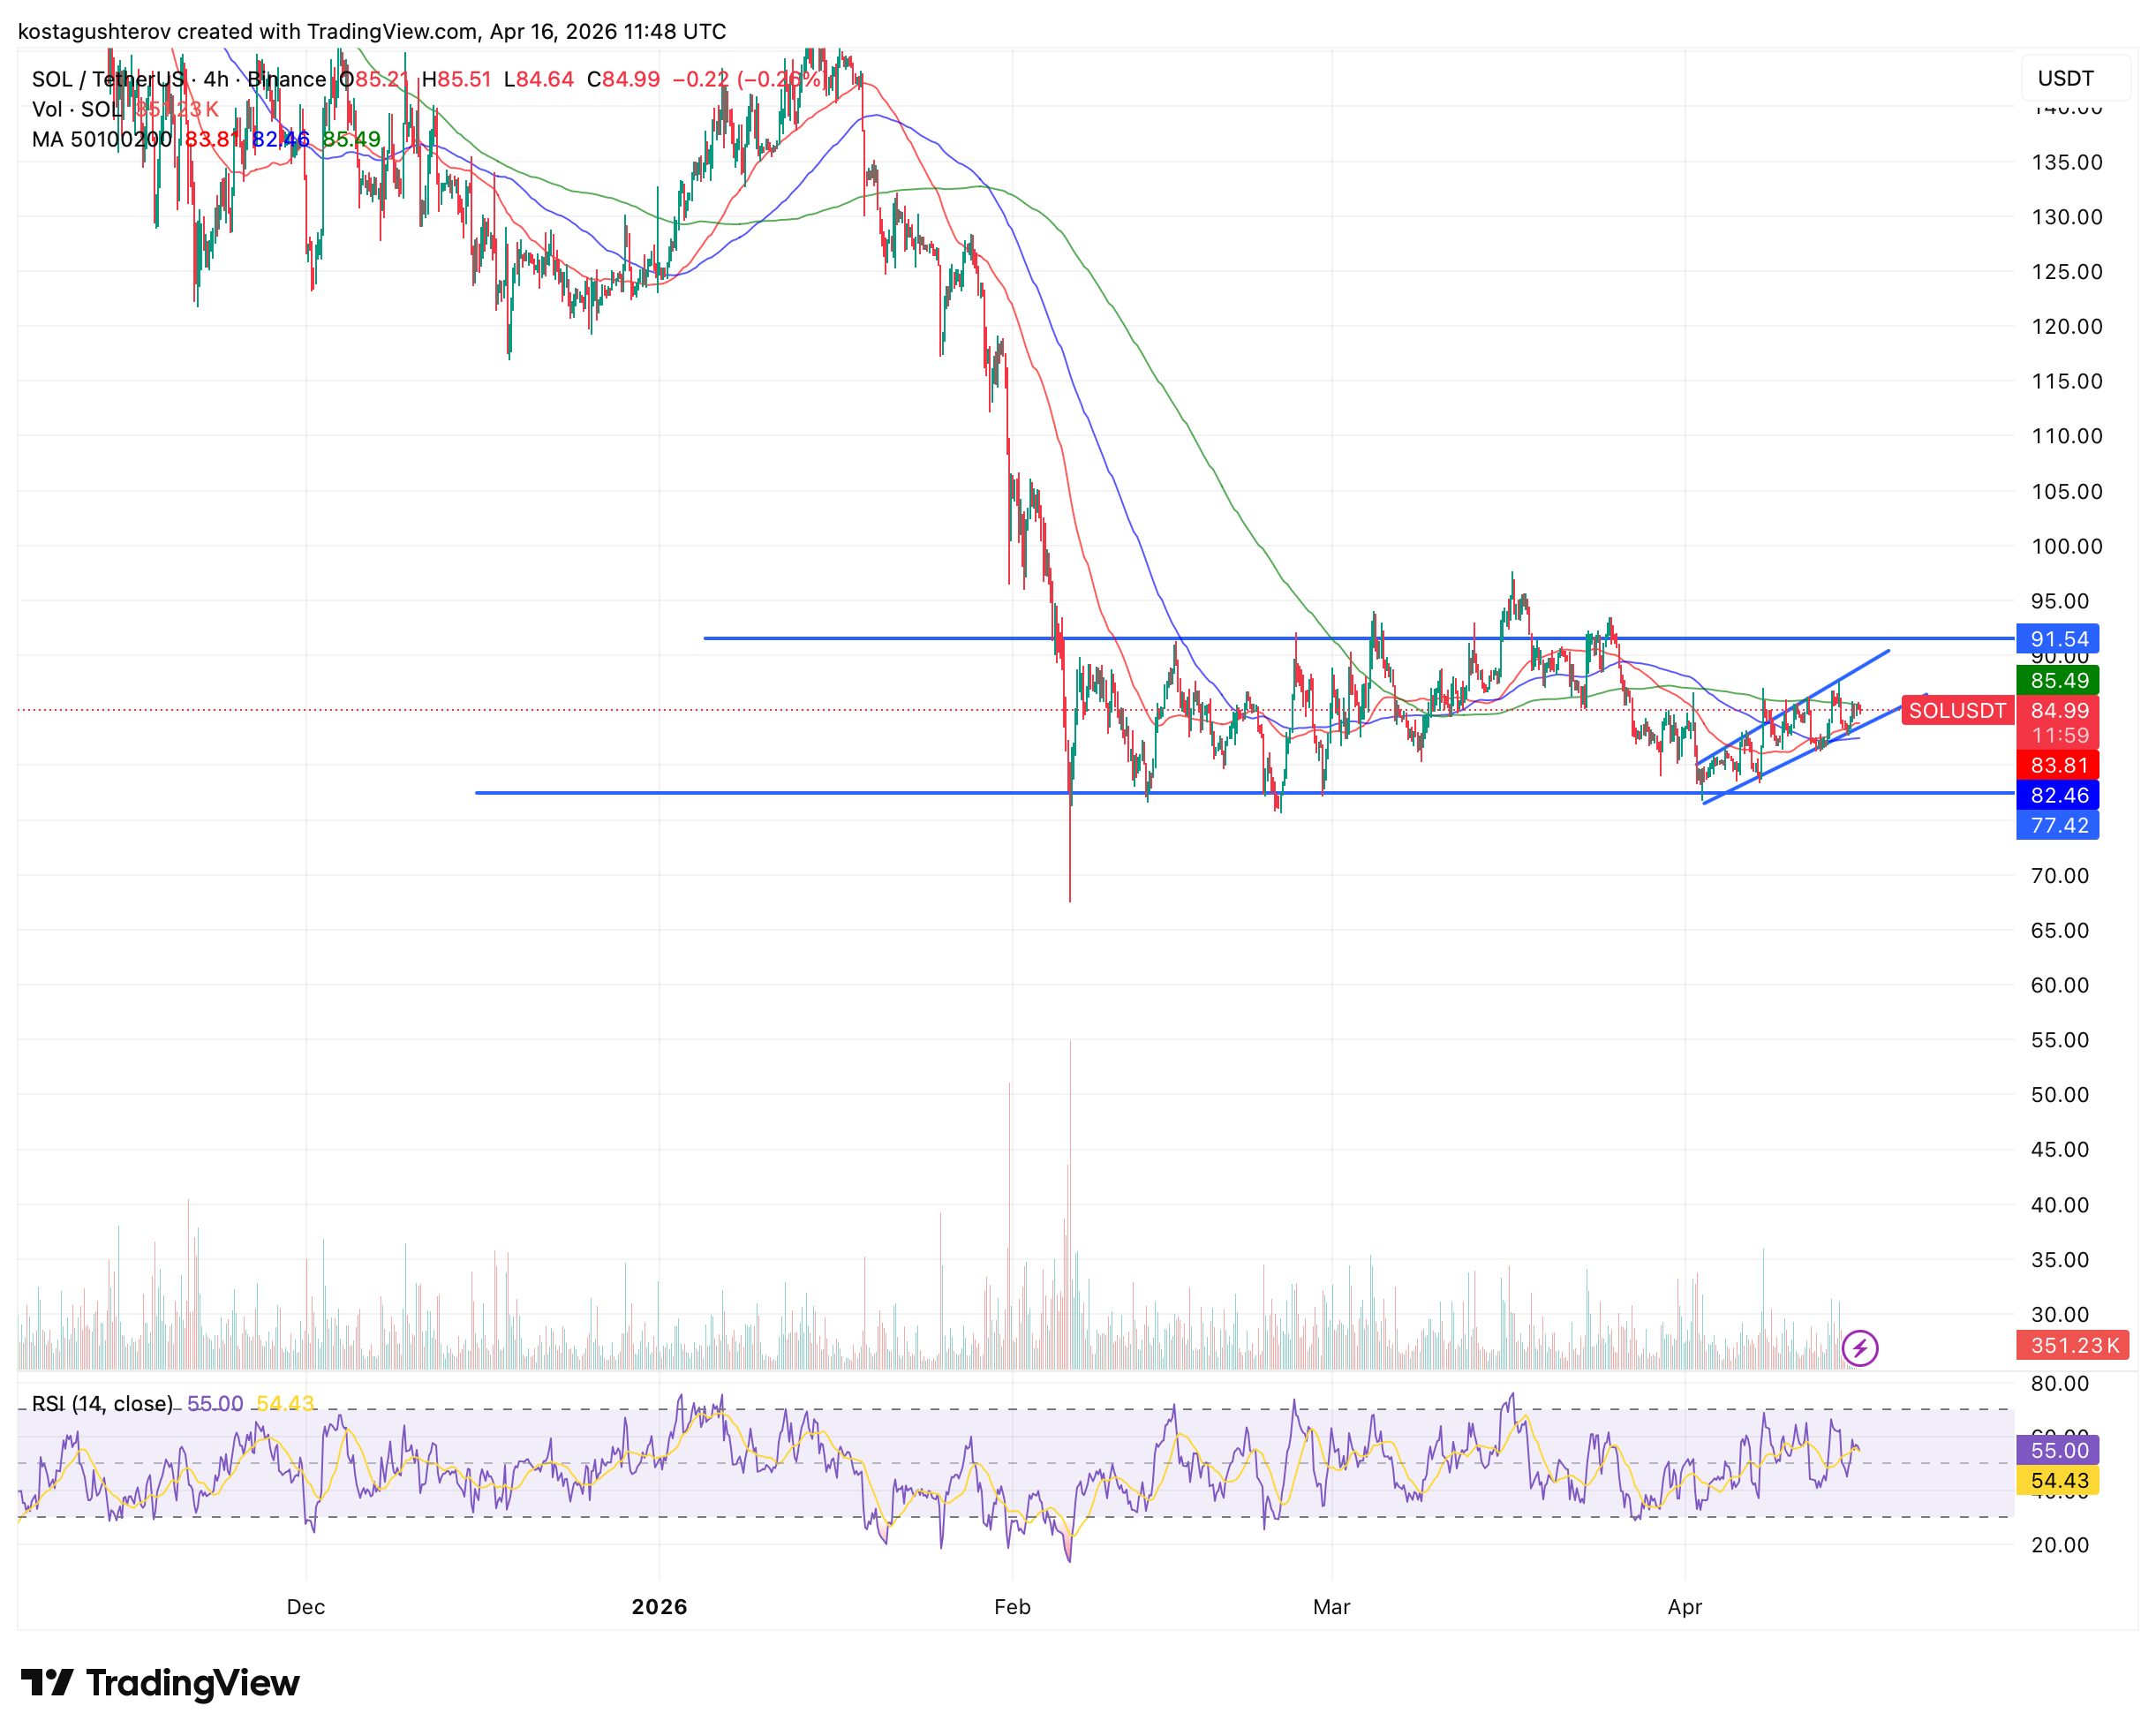
After reaching highs around $250 at the end of September 2024, Solana entered one of the most aggressive downtrends of this cycle. In December, the 50MA crossed below both the 100MA and the 200MA almost simultaneously, a classic death cross that formally confirmed the downtrend and signaled that sellers were firmly in control. From peak to trough, Solana lost approximately 70% of its value, dropping to the $77 lows seen in February.
Since then however, something has changed. Price has stopped making new lows. Instead, it has been moving sideways in a tight range for over two months, and that silence is worth paying attention to.
RSI has just crossed above the 50 midline, currently sitting at 51. It is the most fragile momentum recovery of all the major coins analyzed this week, but that is not necessarily bearish. It simply means the move has not fully started yet. RSI at 51 with six weeks of institutional inflows behind it and a golden cross forming above is a coiled spring, not a broken one.
The Accumulation
As seen on the chart, after the drop to the $77 level buyers stepped in aggressively, sending price back up to the $88 range and forming a textbook accumulation rectangle from mid-February through the last weeks of March. The rectangle is defined by a clear floor at $77 and a ceiling at $92.8, a level that has been tested five times since the beginning of February without a clean break above it.
The accumulation rectangle is a classic technical analysis pattern that indicates a period of consolidation during which major players and institutions quietly accumulate an asset while waiting for the price to begin a new uptrend. Supply is absorbed near the support, buying stops near the resistance, and the process repeats until sellers are exhausted. The chart is showing precisely that behavior, and the ETF data confirms it.
During the same weeks the rectangle was forming on the chart, institutional inflows into SOL spot ETFs painted a clear picture according to SoSoValue data. The week of February 13 saw $13.17M flow in, followed by $14.31M the week of February 20. Then came the most telling moment – the week of February 27, right after the capitulation bottom, institutions put in $44.44M in a single week, the largest inflow of the entire period.
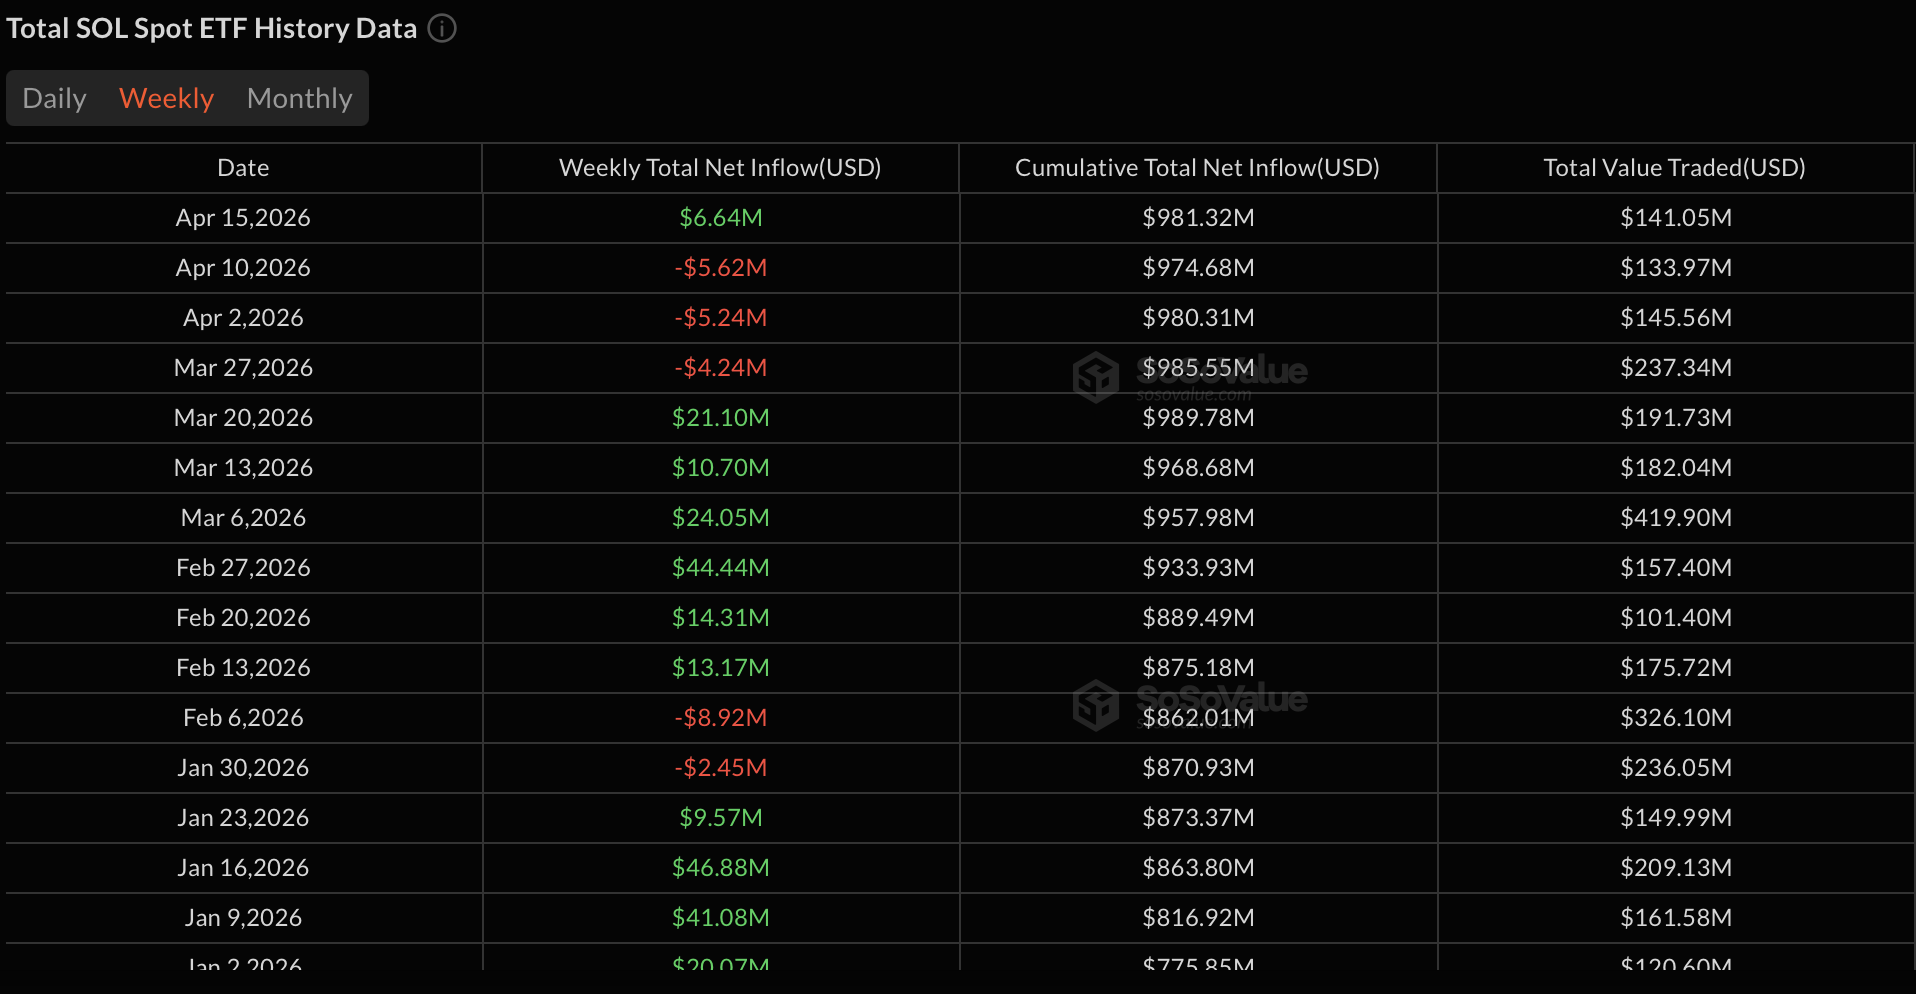
That is not passive investing ,that is conviction buying at the lows. The buying continued through March, with $24.05M the week of March 6, $10.70M the week of March 13, and $21.10M the week of March 20. Six consecutive weeks of institutional money flowing in while price went nowhere, that is the accumulation rectangle playing out in real time, confirmed by real money.
A New Development
Since the beginning of April, a more immediate pattern has emerged. Solana has been forming a short-term uptrend channel, with price making higher lows and attempting to push through the $92.88 resistance, the ceiling of the broader accumulation rectangle. This resistance has now been tested five times since February without a confirmed break. Each failed attempt adds weight to the level, but also builds pressure, the more times a resistance is tested, the more significant the eventual break becomes.
If price manages a clean daily close above $92.88, the next resistance is the 100MA at $97.34, sitting just above. Beyond that, $117 becomes the key level to watch, not as a mathematical target, but because that is the exact area where the major capitulation drop began in late 2024, making it a zone with strong historical resistance and significant market memory.
If the breakout fails however, price risks falling back toward the floor of the accumulation rectangle. A break below that level would invalidate the entire accumulation thesis and open the door to considerably more downside.
A Bullish Signal
Adding to the constructive picture is a developing signal on the moving averages. The 50MA is crossing above the 100MA, a bullish long-term trend reversal signal known as a golden cross. It indicates that short-term price momentum is rising faster than the long-term trend, signaling a shift from selling pressure to buying pressure and the potential for continued upward price movement. Coming after the death cross that confirmed the downtrend in December, this crossover is a meaningful development, it does not guarantee a reversal, but it is the first technical signal that the tide may be turning.
But Is It Really the Bottom?
The accumulation thesis is compelling – but it is still a thesis, not a fact, and the bearish case deserves equal attention.
The rectangle itself is not guaranteed to resolve to the upside. In a sustained downtrend, the same pattern can act as a continuation formation rather than a reversal, price consolidates, flushes the remaining buyers below support, and continues lower. Three tests of $77 holding is bullish, but a fourth test with stronger selling volume could break it cleanly.
Macro Context: Iran–US Talks Could Be the Catalyst
As with Bitcoin, Ethereum, and Dogecoin, the immediate macro catalyst to watch is the outcome of the second round of Iran–US ceasefire talks. As seen consistently over the past weeks, every major geopolitical development has moved crypto sentiment rapidly in one direction or the other. A positive outcome could provide the fuel Solana needs to push through $92 and begin a sustained move higher. A breakdown in talks would likely keep price pinned inside the range or push it back toward the $77 support.
The Breakout Has Not Happened Yet
The chart is building toward something. The accumulation rectangle, the institutional ETF inflows, the short-term uptrend channel, and the developing golden cross all point in the same direction. But the confirmation has not arrived. A clean daily close above $92 with strong volume is the signal to watch, until that happens, the thesis remains unconfirmed and caution is warranted.
The information provided in this article is for educational purposes only and does not constitute financial, investment, or trading advice. Coindoo.com does not endorse or recommend any specific investment strategy or cryptocurrency. Always conduct your own research and consult with a licensed financial advisor before making any investment decisions.

Kosta joined the team in 2021 and quickly established himself with his thirst for knowledge, incredible dedication, and analytical thinking. He not only covers a wide range of current topics, but also writes excellent reviews, PR articles, and educational materials. His articles are also quoted by other news agencies.