

Determining the burned area in forests due to wildfires using Sentinel-2 images with Python in Google Colab


- 🌟 Introduction
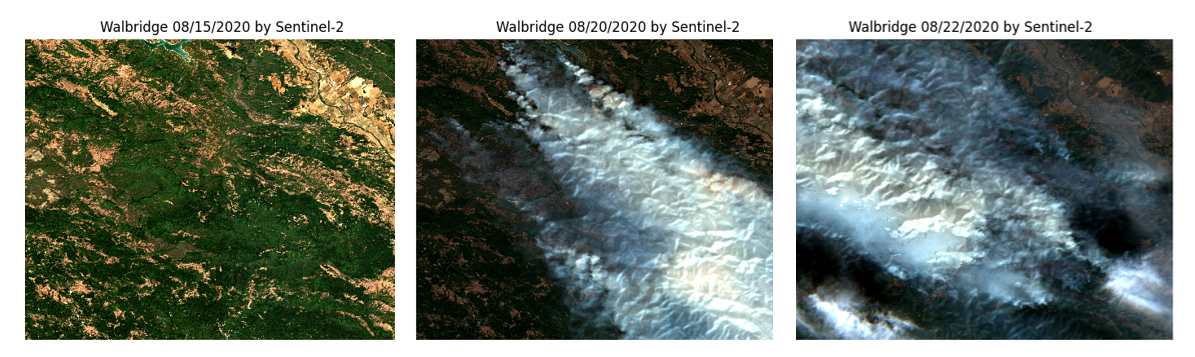
- 🔥 Walbridge Wildfire in California
- 🏷️ Method
- 🚀 Setup Google Colab
- 🛰️ Load Clear Sentinel-2 Images
- 🔢 Count the Number of Vegetation Pixels
- 📈 Plot the Timeseries of the Vegetation Area
- 🌍 Visualization of Sentinel-2 images for Wildfires
- 📄 Conclusion
- 📚 References
🌟 Introduction
Several years ago, when most climate models predicted that more floods, heat waves, and wildfires would happen if we didn’t take the necessary steps, I didn’t expect these unusual catastrophic phenomena to become common events. Among these, wildfires destroy a huge amount of forest area yearly. If you search for a table of major wildfires in different places, you will find alarming statistics showing how much forest area is vanishing from our earth due to wildfires.