

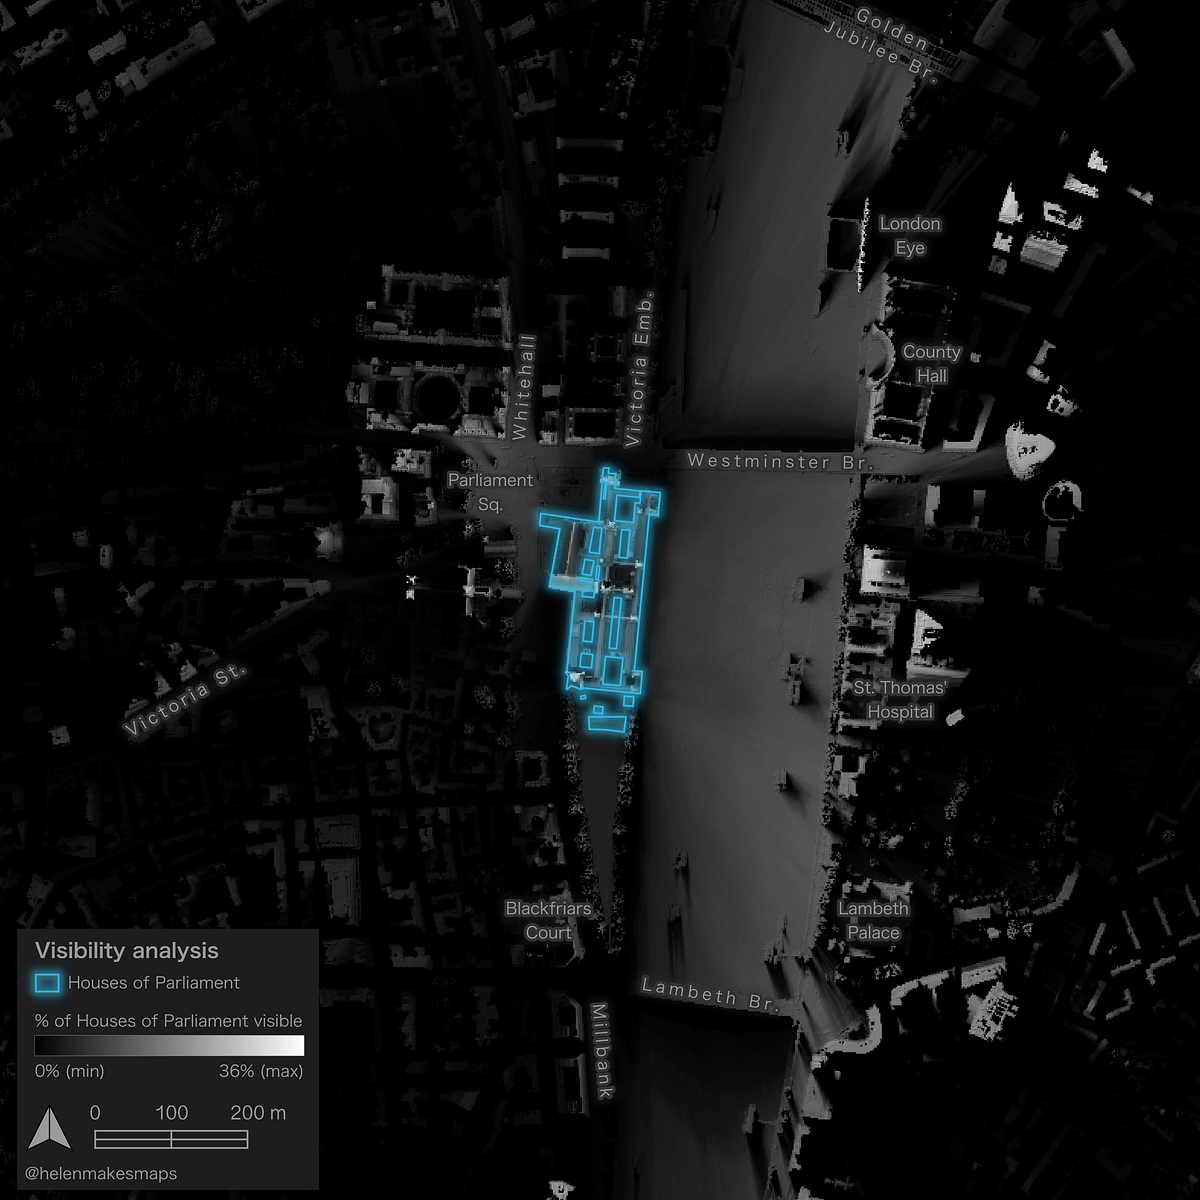
Learn how to easily run visibility analysis with free GIS software and data, and use the results to create stunning visualizations

One of my all-time favourite types of spatial analysis is visibility analysis. It’s a really simple concept, allowing you to work out — theoretically — where something can be seen from. There are two main forms of visibility analysis — also know as viewshed analysis or ZTVs (Zones of Theoretical Visibility). These are:
- The “standard” viewshed: where can I see from this location? E.g. if I’m stood on top of a mountain, what will my view be?
- The “reverse” viewshed: where can see a location? E.g. if I’m stood on top of a mountain, who can see me?
It works by taking a set of observer points and a relief model, then calculating the line of sight between every part of that relief model and the observer points. Sounds like it would be a slow process, right? It can be. But the results are amazing, and indispensible for some applications.
One of the most common applications is to help people to understand where a new development — such as a wind farm, solar panel site or highway — will be visible from. Analysts can then model different scenarios based on their findings, such as what happens to visibility if they plant a line of trees in this exact location? Visibility analysis can also be used to drive pricing strategies for billboards or help…