

Introduction
In recent years, Generative Adversarial Networks (GANs) have achieved remarkable results in automatic image synthesis. However, objectively evaluating the quality of the generated data remains an open challenge. Unlike discriminative models, for which established metrics exist, generative models require evaluation criteria capable of measuring both the visual quality and diversity of the samples produced.
One of the first metrics used was the Inception Score (IS). Based on the predictions of a pre-trained Inception network, the Inception Score provides a quantitative estimate of a generative model’s ability to produce realistic and semantically meaningful images.
In this article, we analyze the idea behind this parameter and a way to understand its validity, analyzing the limitations that have led to the use of other evaluation metrics.
1. What is a Generative Adversial Network (GAN)
Network can be defined as a Deep Learning framework that, given an initial data distribution (Training Set), allows to generate new data (synthetic data) with features similar to the initial distribution.
Usually, to abstract the concept of GAN, we can refer to the “forger and art critic” metaphor. The forger (Generator) aims to paint pictures (synthetic data) that are as similar as possible to the authentic ones (Training set). On the other hand, the art critic (Discriminator) aims to distinguish which pictures are painted by the forger and which are authentic. As you can imagine, the ultimate goal of the forger is to deceive the art critic, or rather, to paint pictures that the art critic will recognize as authentic.
In the early stages, the forger does not know how to deceive the critic, so it will be relatively easy for the latter to recognize the fakes. But step by step, thanks to the critic’s feedback, the forger will be able to understand his mistakes and improve, until he achieves his goal.
Translating this metaphor into practical terms, a GAN consists of two agents:
- Generator (G): is responsible for reproducing synthetic data. It receives a noise vector z as input, usually drawn from a normal distribution N(0,1) with a mean of 0 and variance of 1. This vector will pass through the generator, which will return a “Generated Image.” The funnel shape of the generator is not random. In fact, G performs an up-sampling process: suppose that z has a size [1,300]; as it passes through the various layers of the generator, its size increases until it becomes an image with dimensions [64,64,3].
- Discriminatore (D): discriminates or rather classifies which data belong to the real distribution and which are synthetic data. Unlike the Generator, the discriminator performs a down-sampling process: let’s suppose that the input image has dimensions [64,64,3]; the discriminator will extract features such as edges, colours, etc., until it returns a value of 0 (fake image) or 1 (real image)
The z vector plays an important role. In fact, one property of the generator is that it produces images with different characteristics. In other words, we do not want G to always produce the same painting or similar ones (mode collapse).
To make this happen, I need my vector z to have different values. These will activate the generator weights differently, producing different output features.
2. Inception score (IS)
One of the best “metrics” for evaluating a GAN network is undoubtedly the human eye. But… what parameters do we use to evaluate a generative network? Important parameters are certainly the quality and diversity of the images generated: (i) Quality refers to how good an image is. For example, if we have trained our generator to produce images of dogs, the human eye must actually recognize the presence of a dog in the image produced. (ii) Diversity refers to the network’s ability to produce different images. Continuing with our example, dogs must be represented in different environments, with different breeds and poses.
Obviously, evaluating all the possible images produced by a generator “by hand” becomes difficult. The inception score (IS) comes to our aid. The IS is a metric used to determine the quality of a GAN network in generating images. Its name derives from the use of the Inception classification network developed by Google and pre-trained on the ImageNet dataset (1000 classes). In particular, the IS considers both the quality and diversity properties mentioned above, through two types of probability. The two probability distributions are obtained by considering a batch of approximately 50,000 generated images and the results of the last classification layer of the network.
- Conditional probability (Pc): Conditional probability refers to G’s ability to generate images with well-defined subjects, i.e., to image quality. Images are classified as strongly belonging to a specific class. Here, entropy is low (low surprise effect), or rather, the classification distribution is concentrated on a single class. The dimensions of Pc are [batch,1000].
- Marginal probability (Pm): The marginal probability allows us to understand whether the generator is capable of generating images with different characteristics. If this were not the case, we might have a symptom of mode collapse, i.e., the generator always produces images that are identical to each other. The marginal probability is obtained by considering Pc and calculating the average on the 0 axis (for which we calculate the average on the batch). In this case, the classification distribution should be a uniform distribution. The dimensions of Pm are [1,1000].
An example of what has been explained is shown in the image.

The final step is to combine the two probabilities. This phase is carried out by calculating the KL (Kullback–Leibler) distance between Pc and Pm and averaging it over the number of examples used. In other words, considering i-th the i-th vector of Pc, we see how much the conditional probability of the i-th image deviates from the average.
The desired outcome is for this distance to be high. In fact:
- Assuming that the generator produces consistent images, then, for each image, the conditional probability is concentrated on a single class.
- If the generator does not exhibit mode collapse, then the images are classified into different classes.
And here a question arises: High compared to what?
3. Neighborhood of synthetic data
Let ISᵣₑₐₗ be the Inception Score calculated on the test dataset and ISₛ be the one calculated on the generated data. A generative model can be considered satisfactory when:
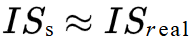
or better when the Inception Score of the synthetic data is close to that of the real data, suggesting that the model correctly reproduces the distribution of labels and the visual complexity of the original dataset.
3.1. Limitations
The introduction of the neighborhood of synthetic data aims to provide a benchmark for interpreting the value obtained. This can be particularly significant in cases where generator G is trained to produce images belonging to the 1000 classes on which the Inception network was trained.
In fact, since the Inception network used to calculate the Inception Score was trained on the ImageNet dataset, consisting of 1000 generic classes, it is possible that the distribution of classes learned by generator G is not directly represented within that semantic space. This aspect may limit the interpretability of the Inception Score in the specific context of the problem under consideration. In particular, the Inception network could classify both the images in the training dataset and those generated by the model as belonging to the same ImageNet classes, producing not consistance values (mode collapse)
In other scenarios, the Inception Score can still provide a preliminary indication of the quality of the generated data, but is still necessary to combine the Inception Score with other quantitative metrics in order to obtain a more complete and reliable assessment of the generative model’s performance.