

Bitcoin was designed as a hedge against inflation, but every hot inflation report in the past year has knocked its price lower, and Thursday’s data was no different. The Producer Price Index rose 1.1% in May, lifting the annual increase to 6.5%, the fastest pace since November 2022 and well above the 0.7% monthly gain economists had expected.
Energy did most of the damage, as final demand goods climbed 2.8%, the largest monthly increase since the series began in December 2009, with energy prices up 10.7% and gasoline surging 23.4% as the Iran conflict keeps oil supply at risk. Even after stripping out food, energy, and trade services, the index rose 0.8% on the month and 5.1% over the year, the steepest core reading since October 2022.
Most people couldn’t tell you what PPI measures, because it tracks transactions consumers never see. The Producer Price Index measures the average change in prices that producers in the US receive for the goods, services, and construction they sell.
CPI captures inflation from the buyer’s side of the register, while PPI captures it from the seller’s side, which means PPI often picks up price pressure weeks or months before households feel it.
The Bureau of Labor Statistics builds the index from a confidential, probability-based sample of producers across the 50 states and Washington, DC, with near-complete coverage in mining and manufacturing and substantial coverage in services.
The reported figure is final-demand PPI, which covers everything sold for personal consumption, capital investment, government purchases, and exports, while a separate family of intermediate-demand indexes tracks the inputs businesses sell to each other.
PPI in 60 seconds
| Question | Answer |
|---|---|
| What it stands for | Producer Price Index |
| Who publishes it | US Bureau of Labor Statistics, monthly |
| What it tracks | Prices received by US producers for goods, services, and construction |
| How it differs from CPI | CPI measures what consumers pay; PPI measures what producers receive |
| Why it’s worth watching | It can signal inflation pressure before it reaches household prices |
| Why Bitcoin cares | Hot PPI weakens rate-cut hopes and tightens liquidity expectations |
| What just happened | May PPI rose 1.1%, pushing the annual rate to 6.5%, with gasoline up 23.4% |
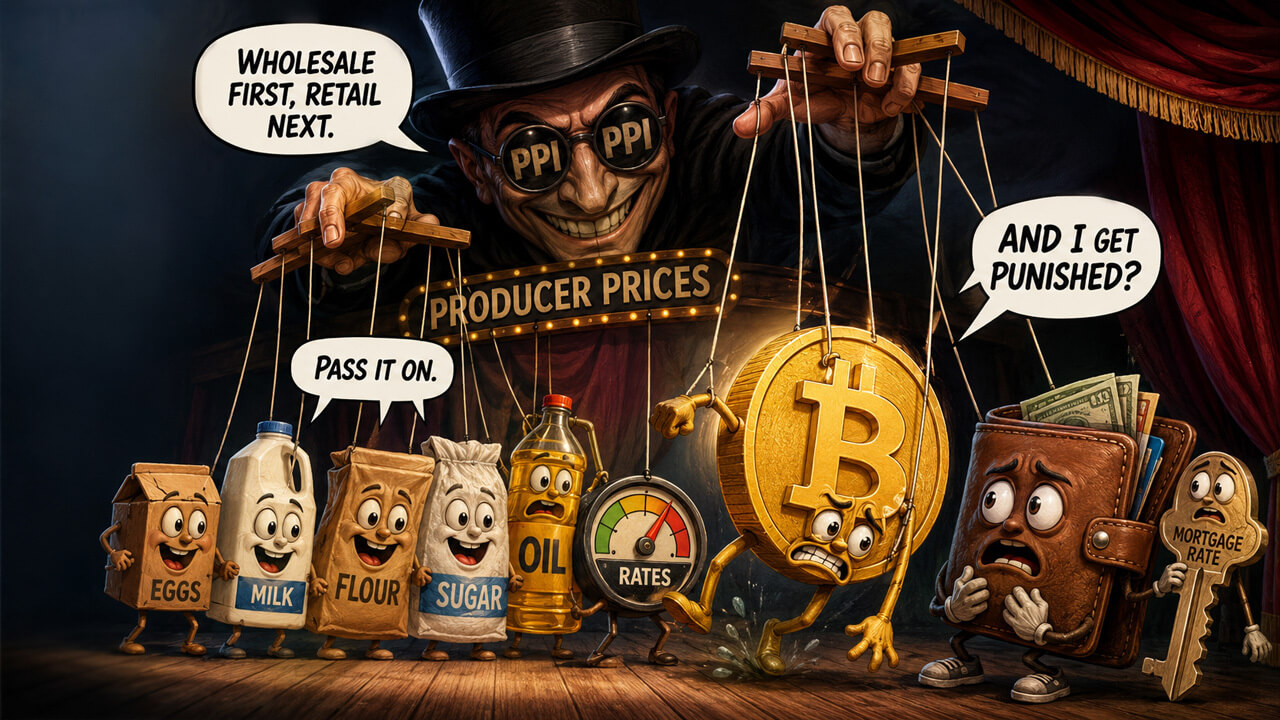
How does a wholesale price report end up in your grocery bill and your mortgage rate?
When producers receive higher prices, somebody eventually has to pay for it down the line. A company facing a 23.4% jump in gasoline costs and a 15.7% rise in diesel can either absorb the hit through thinner margins, pass it along to customers, or split the difference.
The first option pressures earnings, hiring, and stock prices. The second shows up later in shelf prices, delivery fees, airfares, and shipping surcharges. May’s report indicates that the pass-through is already underway, as the pressure on prices extends well beyond fuel.
Prices for processed goods sold between businesses rose 13.3% over the past 12 months, the largest annual increase since August 2022, which means the costs feeding into future consumer prices are rising faster than the prices consumers currently pay.
The relationship between PPI and CPI isn’t perfect. Taxes, import prices, retail margins, and corporate pricing strategy all sit between what a producer receives and what a shopper pays, so a hot PPI month guarantees nothing about next month’s consumer print.
Research from the Richmond Fed shows producer prices flow into consumer prices with lags that vary widely by category. Energy moves fast, since refiners pass costs to pumps within weeks, while services move slowly because wage contracts and leases reset on annual cycles. Wednesday’s May CPI report already showed gasoline up 40.5% year over year, and Thursday’s producer data suggests that the pipeline still has plenty left to deliver.
Policy decisions depend on these numbers, even though no single report automatically triggers anything. The Federal Reserve targets the PCE price index, but several PPI components feed directly into PCE calculations, so economists use producer data to forecast the gauge the central bank actually watches.
April’s PCE reading of 3.8% was already nearly double the Fed’s 2% target before May’s energy shock hit. Beyond monetary policy, PPI indexes get written into long-term supply contracts as escalation clauses, deployed by statisticians to separate real output growth from price increases, and wielded by politicians arguing over energy policy, tariffs, and spending. A 6.5% annual producer inflation rate gives everyone in Washington fresh ammunition.
Bitcoin holders watch PPI because liquidity (and the lack of it) sets the price
Wholesale inflation is connected to decentralized assets like Bitcoin through interest-rate expectations. High producer inflation makes the Fed less likely to cut rates; higher rates make Treasury bills and money-market funds more attractive; the dollar stays strong; and the pool of capital willing to chase volatile assets shrinks.
CryptoSlate has documented how tightly Bitcoin now tracks liquidity cycles, overtaking the halving as the dominant price driver. That’s why a government statistic about diesel fuel and wholesale margins can move an asset that producers will never accept at the factory gate.
The Federal Open Market Committee meets on June 16 and 17, the first meeting chaired by Kevin Warsh since he took over from Jerome Powell in May, and prediction markets price a hold in the 3.50% to 3.75% range as a near certainty.
Hopes for cuts have been eroding all year, from January’s services-inflation shock through March’s repricing toward zero cut probability, and Bitcoin’s slide from its October 2025 record toward the low $60,000s has tracked that deterioration alongside a record streak of ETF outflows worth roughly $3.45 billion.
There’s an important nuance here, though, and it works in Bitcoin’s favor over the longer term. Persistent inflation erodes the purchasing power of cash and bonds, which is what Bitcoin’s fixed supply was essentially built to fix, and CryptoSlate has argued BTC is structured to thrive across a stagflationary decade. What we’re seeing now is inflation helping the long-term thesis, while the policy response to inflation hurts the near-term price.
What comes next will decide which force wins. Watch whether June’s CPI confirms the pass-through, whether the PCE release on June 25 moves the Fed’s preferred gauge further from target, whether oil keeps climbing on Iran headlines, and how Warsh frames the energy spike at his first press conference.
One report never settles an inflation debate, but the asset marketed as inflation insurance just got hit by an inflation warning, and until the Fed can credibly promise easier money, that paradox is likely to keep defining Bitcoin’s 2026.