

XRP’s withdrawal dominance has returned to February 13 levels, but price has broken below the zone that setup once supported.
- Withdrawal transactions at 51.5%, deposits at 48.4%: repeats February 13 structure.
- February 13 setup occurred at $1.38; current price at $1.3654, below that level.
- SMA50 at $1.3947 and SMA100 at $1.3993 now sit above price as combined resistance.
- RSI at 42.00, signal at 53.14: momentum negative, 11-point spread still widening.
- SMA200 declining at $1.7091, well above price, no near-term technical support from above.
XRP’s 7-day Binance withdrawal transaction share has reached 51.5% against a deposit share of 48.4%, according to CryptoQuant data, repeating a flow structure last recorded on February 13, 2026. The on-chain setup is familiar. The price context it is appearing in is not.
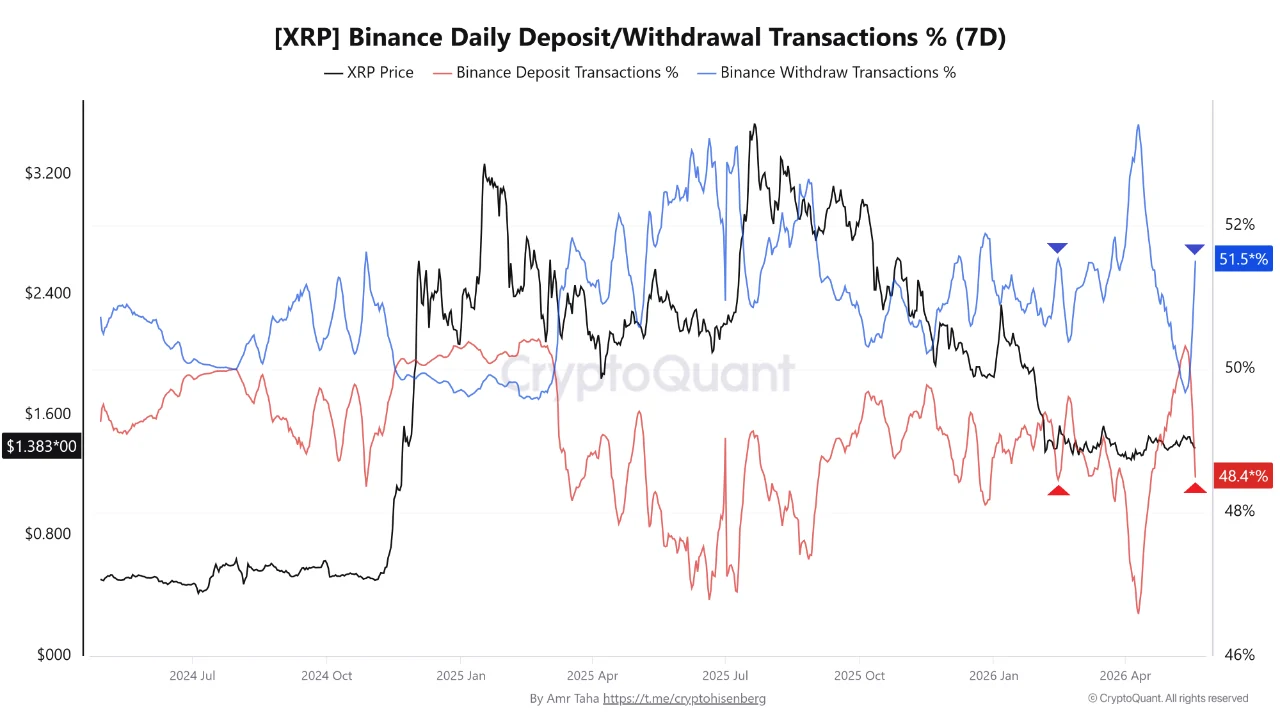
The deposit and withdrawal transaction percentage metric tracks the share of Binance transaction count flowing in each direction on a 7-day basis. When withdrawal transactions dominate, more transaction activity involves coins leaving Binance than arriving. Taha notes this may point to reduced immediate exchange-side supply or a preference to move coins off-platform, and that rising deposit dominance can be associated with selling readiness as more coins move toward the exchange. The current 3.1 percentage point spread in favor of withdrawals is not extreme by historical standards, but the direction is confirmed across the 7-day window.
Why the February 13 comparison requires a structural qualifier
The withdrawal dominance reading repeats the February 13 structure, but the February setup occurred with XRP approaching $1.38 from below; the current reading occurs with XRP having just broken below that level, which makes the same on-chain signal a structurally different market condition. On February 13, the $1.38 zone represented a level price was testing as it moved higher. Today, having closed at $1.3654 following a 1.77% decline, XRP is below that reference point and below both of its short-term moving averages simultaneously.
What the MA structure and RSI add
The SMA50 at $1.3947 and the SMA100 at $1.3993 are separated by less than half a cent, and price trading below both simultaneously turns what would normally be two distinct support levels into a single combined resistance ceiling at current levels. Both MAs are flattening after a prolonged decline. Price needs to recover above $1.3993 to clear both in a single move.
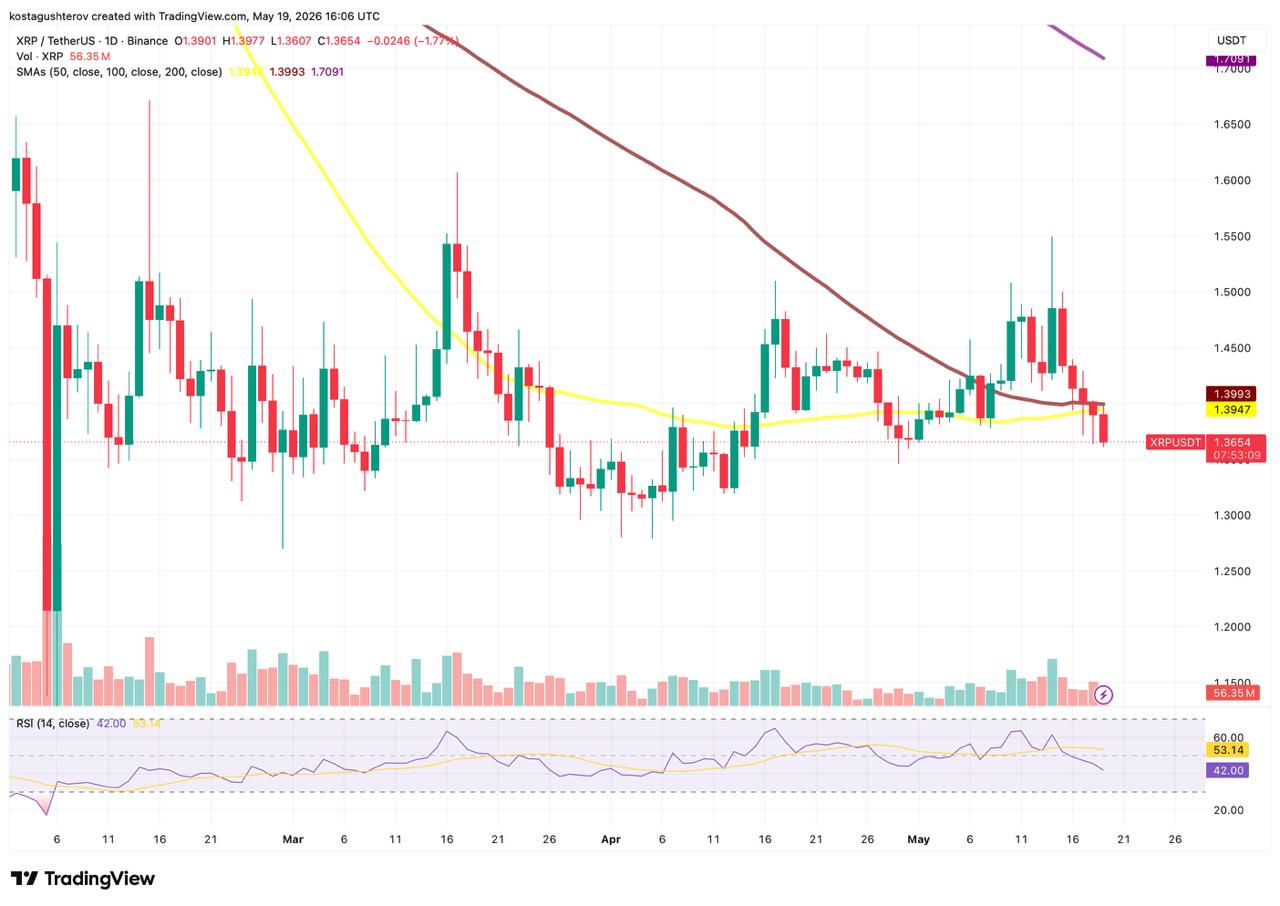
An RSI of 42 sitting 11 points below its signal line on the daily confirms that momentum has turned negative before price has moved far from the MA cluster. Analytically, this configuration, where momentum deteriorates sharply while price remains close to its MAs, tends to produce directional resolution within the following five to seven sessions rather than extended sideways compression. RSI below 50 confirms net-negative daily momentum. The signal line at 53.14 sitting well above the RSI indicates the deterioration is recent and still in progress. The SMA200 at $1.7091 is declining steeply and sits $0.3437 above current price, functioning as long-term resistance rather than any near-term reference point.
If XRP reclaims both the SMA50 and SMA100 above $1.3993 on a closing basis within the next three sessions while withdrawal dominance holds above 50%, the on-chain structure and the price structure will be aligned for the first time since February. If price continues below $1.36 and RSI approaches the 35 level, the breakdown will have confirmed that the February parallel does not extend to the outcome that followed it.
The information provided in this article is for educational purposes only and does not constitute financial, investment, or trading advice. Coindoo.com does not endorse or recommend any specific investment strategy or cryptocurrency. Always conduct your own research and consult with a licensed financial advisor before making any investment decisions.